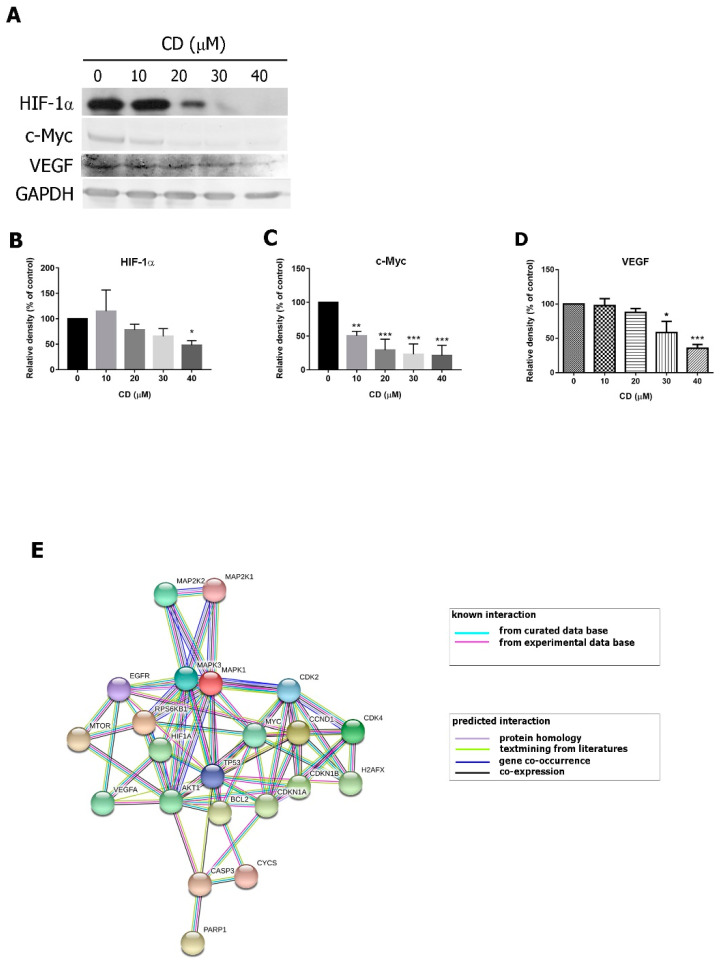
Figure 8.
The effects of CD on c-Myc, HIF-1α, and VEGF proteins. (A) The protein expressions of c-Myc, HIF-1α and VEGF. GAPDH was used as an internal control. (B–D) Quantification results of each protein. Bar graphs show normalized values as percentages relative to the control. Data are expressed as mean ± SD of three to four independent experiments. * p < 0.05, ** p < 0.01, *** p < 0.001 as compared to the control group (0 µM). (E) The protein interaction map.

