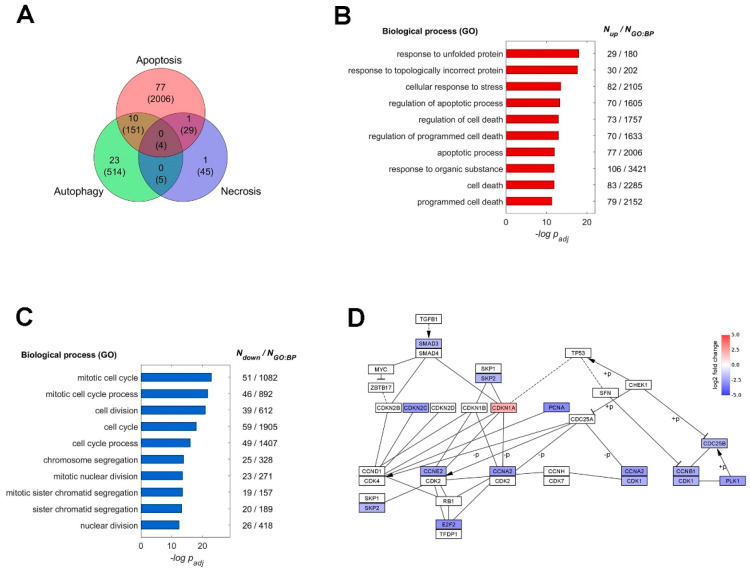
Figure 9.
The altered expression profile upon the CD treatment. (A) The number of up-regulated genes are depicted in the Venn diagram showing their roles in types of programmed cell death. The intersection areas indicate the number of genes participating in multiple processes. The total number of genes in each category is indicated in parentheses. The top 10 enriched GO biological processes from the up-regulated (B) and down-regulated (C) genes and with the adjusted p-values are plotted on a negative logarithmic scale. The number of up-regulated genes and the total number in each process are also shown on the right of the plot. (D) The KEGG pathway of cell cycle progress. Genes with altered expression are color-coded for the log2 fold changes (red: up-regulated; blue: down-regulated; +p phosphorylation; −p dephosphorylation). The KEGG pathway map was acquired from Kyoto Encyclopedia of Genes and Genomes (https://www.genome.jp/kegg/) and the plot was performed by Cytoscape.

