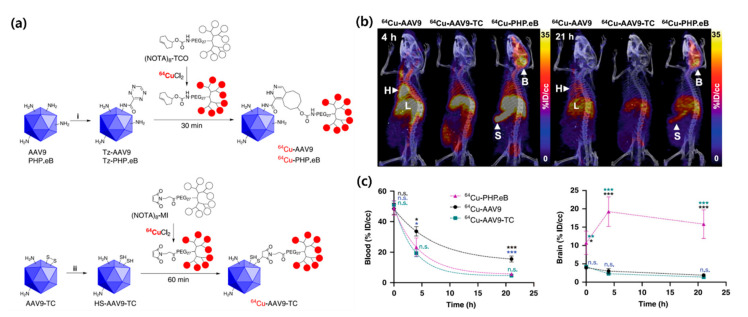
Figure 4.
(a) Radiolabeling of adeno-associated viruse (AAV) capsids. (b) PET/CT images of 64Cu-labeled AAV 4 h and 21 h after intravenous injection (B = Brain, H = Heart, L = Liver, S = Spleen). (c) Time–activity curves for blood and brain uptake. Reprinted with permission from Seo et al. [50].

