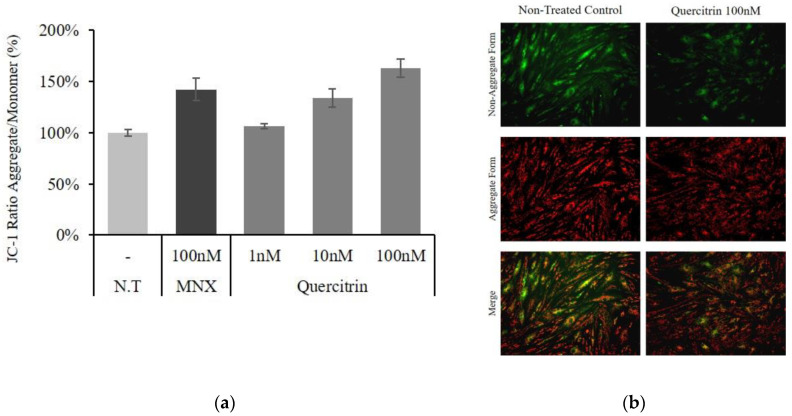
Figure 2.
Effect of quercitrin on cellular energy metabolism in cultured hDPCs. (a) Mitochondrial membrane potential was measured after quercitrin treatment (1, 10, and 100 nM) for 24 h. The 100 nM minoxidil was used as a positive control. (b) JC-1 monomer form was seen as green and aggregate form as red by fluorescent microscopy. N.T, non-treated control; MNX, minoxidil. Significantly different compared with N.T (* p < 0.05, ** p < 0.01, *** p < 0.001).

