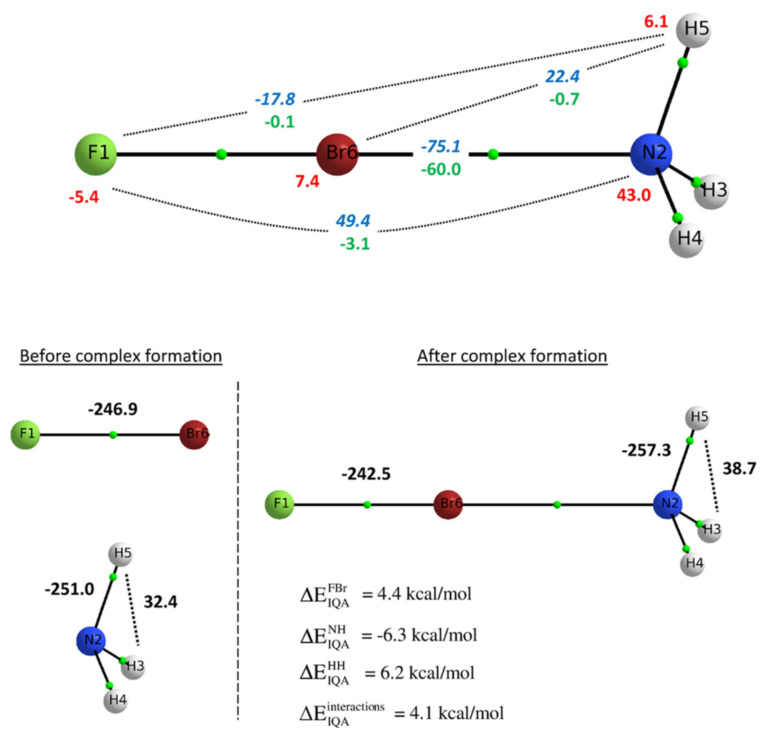
Figure 4.
IQA energy partition of the FBr ⋯ NH complex. (Top) changes intra-atomic energies (red) and intermolecular interactions (classical and exchange terms in blue and green, respectively). (Bottom) Change in interatomic energies within each fragment upon complex formation. Figure reprinted (adapted) with permission from reference [98]. Copyright 2020 American Chemical Society.

