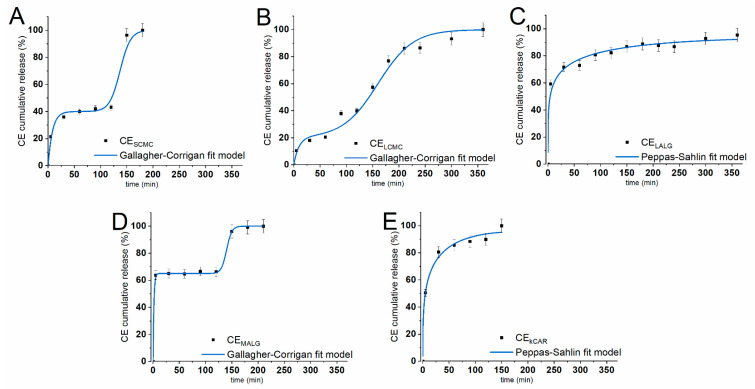
Figure 4.
In vitro cumulative release profiles of CE from the polysaccharide microparticles (dots) (A) SCMC, (B) LCMC, (C) LALG, (D) MALG, and (E) κCAR) under conditions simulating the stomach (0–120 min) and intestines (121–360 min). Solid lines correspond to CE release profiles that best fit the selected kinetic models, namely, the Gallagher–Corrigan and Peppas-Sahlin models. The results are presented as the means ± S.D.

