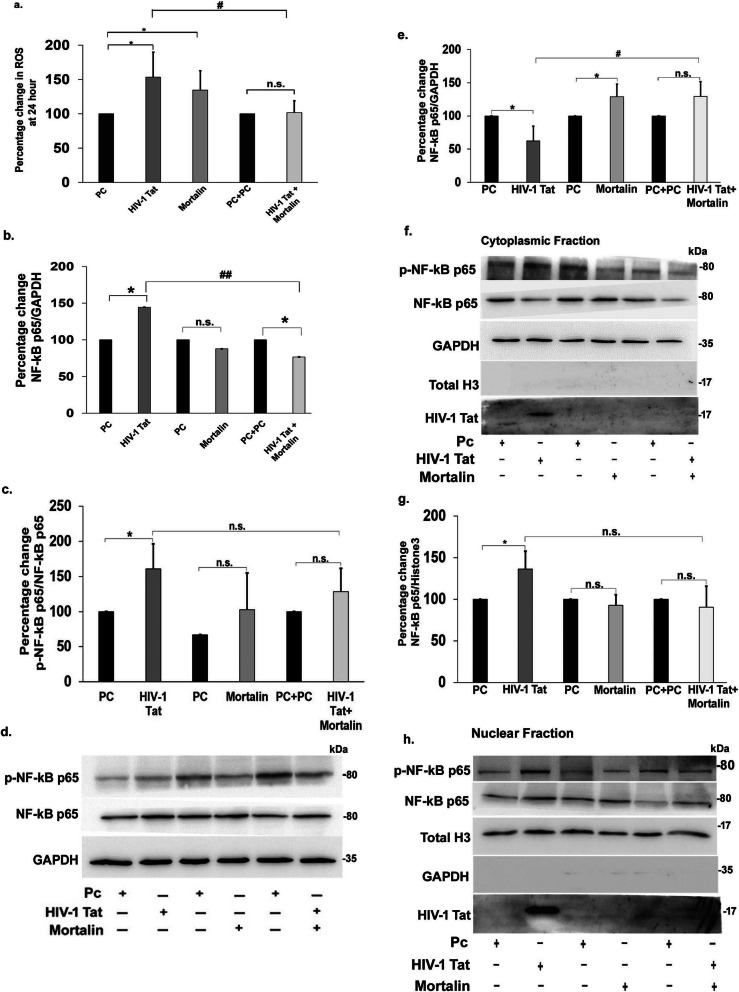
Fig. 7.
Assessment of ROS production and activation of NF-kB-p65. a) Percentage change showing levels of ROS in PDA post 24 h transfection with indicated plasmids (n=4). b) Percentage change showing the levels of total NF-kB-p65 in post transfected PDA (n = 5). c) Representative change in the expression of phosphorylated-NF-kB-p65 in all transfected PDA groups is represented in the graph (n=5). d) Representative western blot showing change in expression of NF-kB-p65 and phosphorylated NF-kB-p65 in transfected PDA (n=5). GAPDH was used as the loading control. e) Percentage change of the cytoplasmic fraction in PDA post 24 h transfection showing the levels of Nf-kB-p65 (n = 4). f) Expression levels of cytoplasmic Nf-kB-p65 were evaluated by represented western blots. GAPDH was used as the internal control (n=4). g) Percentage change of the nuclear fraction in PDA post 24h transfection showing the levels of Nf-kB-p65 (n=4). h) Expression levels of nuclear Nf-kB-p65 were evaluated by represented western blots.Total histone3 was used as the internal control (n =4). All data represent mean ± standard deviation from independent experiments (n stands for number of independent experiment), *p< 0.05, with respect to control, #p< 0.05, ##p< 0.005 with respect to HIV-1 Tat and cotransfected group (PC stands for plasmid control, and PC+PC is used as plasmid control in cotransfected cells)

