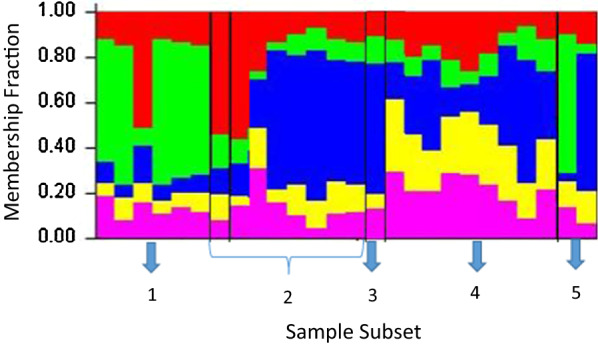
Fig. 6.

The population structure (the membership fraction for each sample sub-set) of Plasmodium vivax plotted according to the year in which the isolates were collected inferred from genotyping of parasite isolates (at K = 5). Each bar represents an isolate. Cluster 1-isolates from 2005 (n = 6), cluster 2-isolates from 2006 (n = 1) and 2007 (n = 7), cluster 3-isolates from 2009 (n = 1), cluster 4-isolates from 2010 (n = 8) and cluster 5-isolates from 2011 (n = 2). Seven isolates for which the year of collection is unknown and isolates with multi-clone infections (n = 19) were excluded from structure analysis
