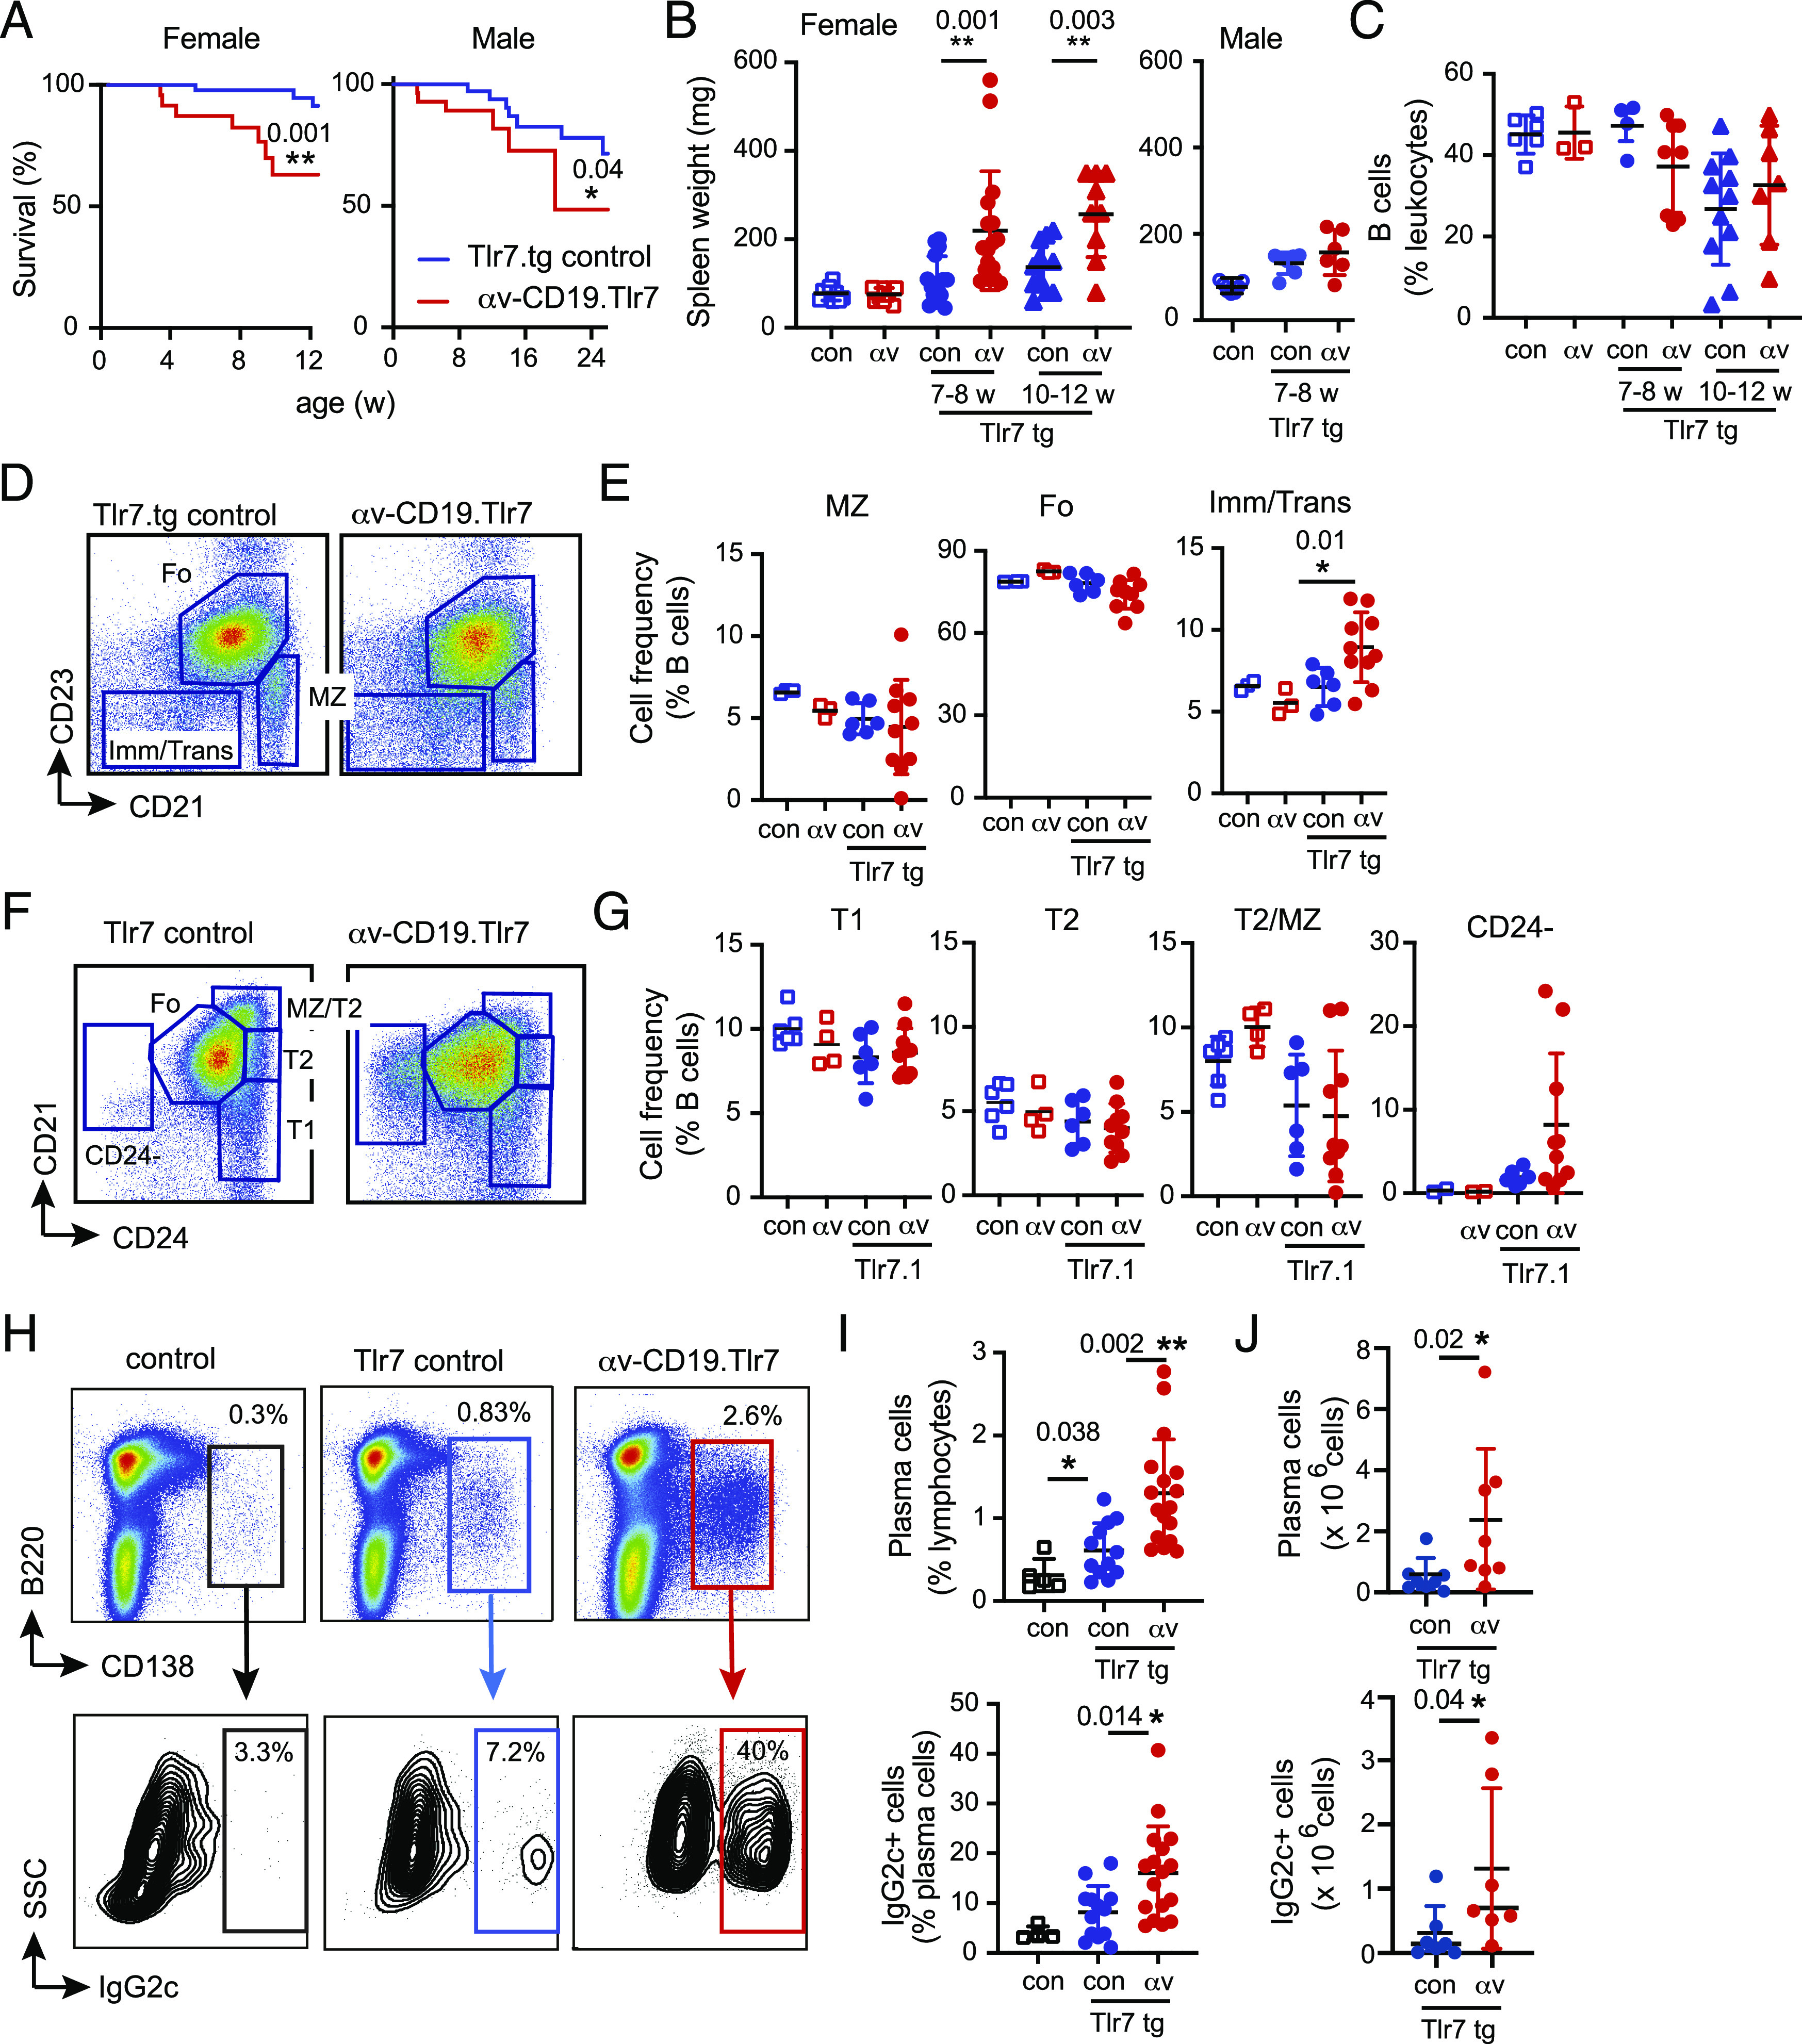
FIGURE 1.

αv deletion promotes expansion of plasma cells. (A) Survival of female and male Tlr7.tg control and αv-CD19.Tlr7 mice (n ≥ 17 mice per group). (B) Spleen weight from control mice (con), αv-CD19 (αv), control Tlr7.tg (con-Tlr7.tg), and αv-CD19.Tlr7 mice (αv Tlr7.tg). Groups analyzed are 7–8-wk-old males (n ≥ 6 per group) and females (n ≥ 10 per group) and 10–12-wk-old females (n ≥ 7 mice per group). (C) Spleen B cell frequency in female mice at 7–8 and 10–12 wk of age (n ≥ 4 mice per group). (D–G) Splenocytes were gated on CD19+ cells, and the frequencies of immature/transitional (Imm/Trans), T1 and T2, MZ, Fo, and CD24-negative B cells determined by flow cytometry as shown. Analysis of non-tg control and αv-CD19 mice are included for comparison (n = 3–6 per group of non-tg and 6–10 per group of tg mice). (H–J) Spleen plasma cells were identified based on CD138 staining and analyzed for intracellular IgG2c and quantified by percentage of parent population (n = 5 for non-tg mice and n ≥ 13 per group for tg mice) (I) or total number of cells per spleen (n = 8 mice per group) (J). Data are presented as data points from individual mice. Shown are p values <0.05 for comparisons between control Tlr7.tg and αv-CD19.Tlr7 mice. *p < 0.05, **p < 0.01, calculated using log-rank test [survival curves (A)] or Mann–Whitney U test.
