FIGURE 4.
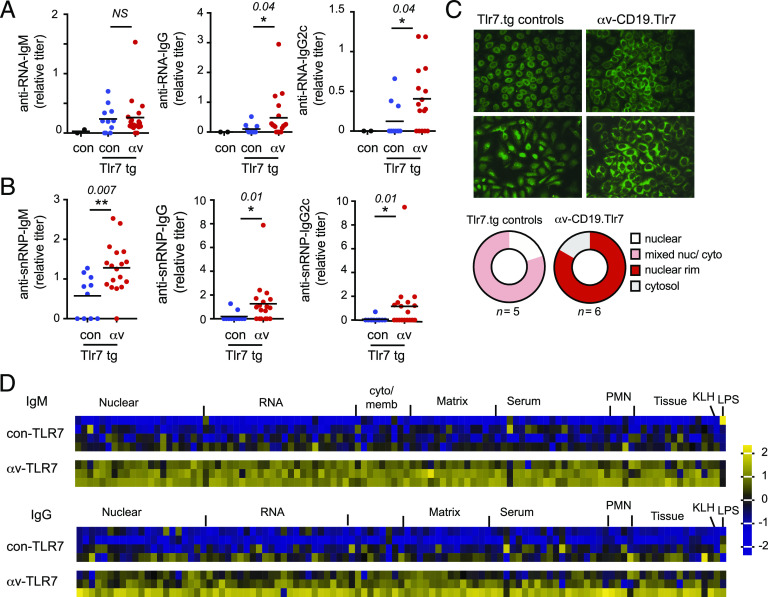
αv deletion from B cells increases autoantibody production (A). (A and B) Serum titers of anti-RNA and anti-snRNP Abs from 7 to 8-wk-old wild-type control, control Tlr7.1 tg, and αv-CD19.Tlr7.1 tg mice (n ≥ 11 per group). The p values <0.05 (Student t test) for comparisons between control Tlr7.1 tg and αv-CD19.Tlr7.1 tg mice are shown (*p < 0.05, **p < 0.01). (C) HEp-2 cell staining patterns of serum Abs from 7- to 8-wk-old control Tlr7.1 tg and αv-CD19.Tlr7.1 tg mice. Two representative images are shown per genotype. Original magnification ×40. Pie charts show summary of patterns for 5–6 mice per genotype. (D) Serum IgM and IgG autoantibodies from 7- to 8-wk-old control Tlr7.1 tg (n = 4) and αv-CD19.Tlr7.1 tg (n = 3) mice measured using an autoantibody array chip containing 88 specific autoantigens. Data are shown as a heat map of z-scores. Autoantigen class is shown, along with control Abs (anti-KLH and anti-LPS).

