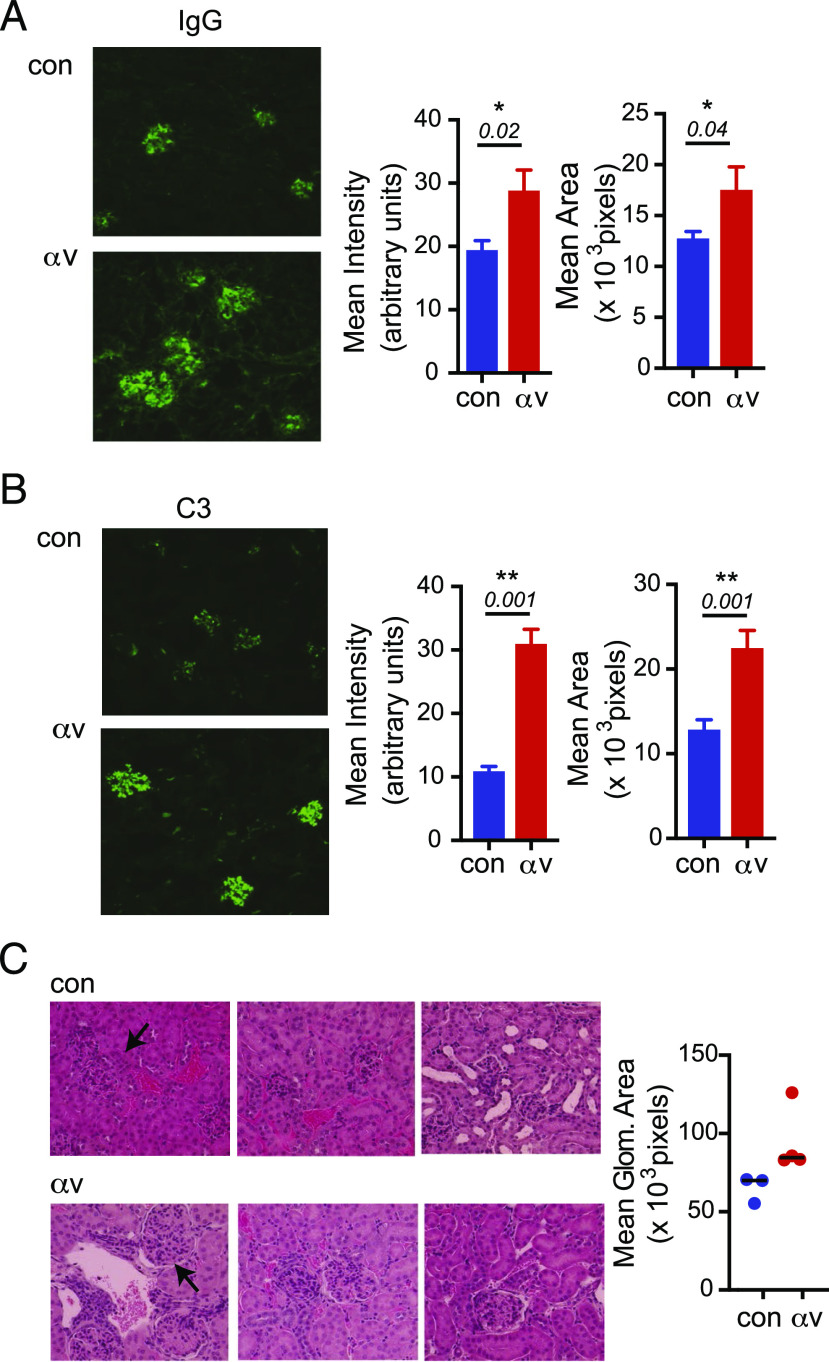
FIGURE 5.
αv deletion increases kidney Ab deposition and glomerulonephritis. (A and B) Glomerular immune complex deposits determined by immunofluorescence staining for IgG (A) and complement C3 (B). Left panels show representative images from 7- to 8-wk-old control Tlr7.1 tg and αv-CD19.Tlr7.1 tg mice. Original magnification ×60. Right panels show intensity and area of staining. (C) Histological analysis of H&E-stained representative sections. Original magnification ×40. Graph represents quantification of glomerular size. Data are mean ± SD for at least n = 3 mice per group. The p values <0.05 (Mann–Whitney U test) for comparisons between control Tlr7.1 tg and αv-CD19.Tlr7.1 tg mice are shown. *p < 0.05, **p < 0.01.

