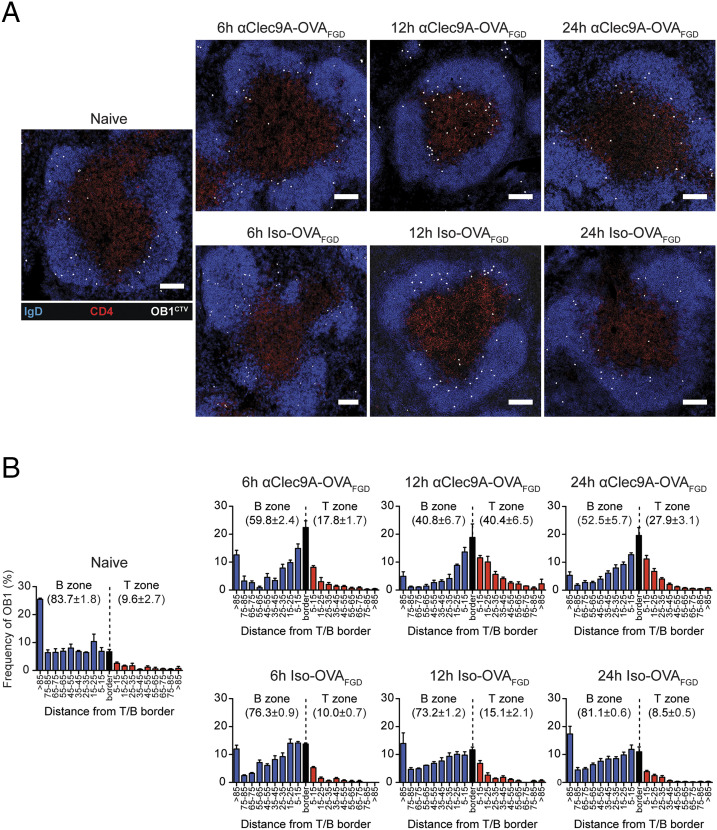
FIGURE 5.
Clec9A-mediated activation of B cells facilitates their migration toward the T–B border. A total of 1 × 10⁶ CTV+ OB1 cells were adoptively transferred into B6 mice 1 d before vaccination with 0.5 μg of αClec9A–OVAFGD or isotype–OVAFGD. The spleens were harvested at 6, 12, and 24 h postimmunization for histological analysis. (A) Representative immunofluorescence images of splenic white pulp showing changes in the distribution of CTV+ OB1 cells (white) over time. Frozen spleen sections were stained for IgD (blue), CD4 (red), and laminin (data not shown) to highlight the B cell follicles and the T cell zone. Scale bar, 100 μm. (B) Bar graphs showing relative distribution of OB1 cells in the white pulp over time. OB1 cells in the B cell follicles (blue) and T zone (red) were identified and subdivided based on the minimum distance from the T–B border. Cells within 5 μm of the T–B border were considered to be on the “border” region (black). Bars represent the mean and error bars indicate the SEM. The average frequency ± SEM of OB1 in the B cell follicles and T zone are indicated in each graph. Pooled data from two independent experiments are presented with n = 3 mice per time point for each treatment.

