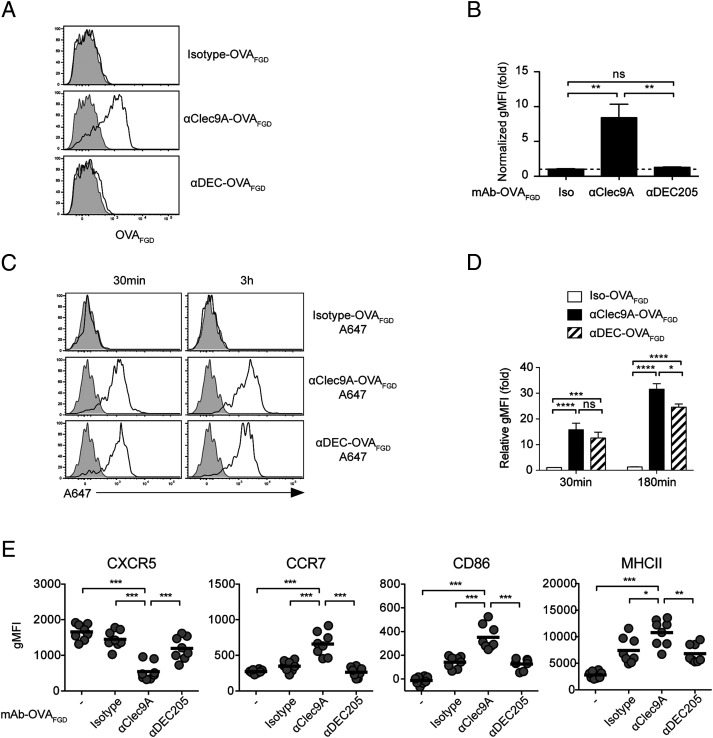
FIGURE 9.
cDC1 surface expression of the B cell epitope is a feature of Clec9A-targeted vaccination. (A and B) B6 mice were vaccinated with 2 μg of isotype–OVAFGD, αClec9A–OVAFGD, or αDEC–OVAFGD. Low-density cells were enriched from the spleen at 2 h postvaccination and surface stained for the OVAFGD epitope using biotinylated anti-OVAFGD Ab (generated from serum of OB1 mice), followed by streptavidin–allophycocyanin. (A) Representative histograms show staining for OVAFGD detectable on the surface of cDC1 (CD11chiCD8α+CD11bloB220−CD3−CD19−PI− low-density single cells) from vaccination mice (black lines) and unvaccinated mice (gray shading). (B) The geometric mean fluorescence intensity (gMFI) of the surface OVAFGD levels from vaccinated mice normalized against cDC1 from naive mice (n = 4 mice per group); mean ± SEM. (C and D) cDC1 efficiently capture Ag targeted via Clec9A or DEC205 in vivo. B6 mice were vaccinated with 2 μg of isotype–OVAFGD (Iso–OVAFGD)–A647, αClec9A–OVAFGD–A647, or αDEC–OVAFGD–A647. Low-density cells enriched from the spleen at 30 min or 3 h postvaccination were examined by flow cytometry. (C) Representative histograms show the level of A647 on cDC1 (CD11chiXCR1+CD11blo B220−CD3−CD19−PI− low-density cells). (D) gMFI of A647 in cDC1 from vaccinated mice normalized against cDC1 from naive mice (n = 6 mice per group for each time point); mean ± SEM. (E) Targeting Ag to DEC205 does not enhance early B cell activation. A total of 1 × 10⁶ CTV+ OB1 cells were adoptively transferred into CD45.1+ mice 1 d before vaccination with 2 μg of Iso–OVAFGD, αClec9A–OVAFGD, or αDEC–OVAFGD. Activation of OB1 (CTV+CD19+CD3−CD45.1−PI−) was assessed 24 h postimmunization based on the expression of CXCR5, CCR7, CD86, and MHC II. Each symbol represents a mouse, and horizontal lines indicate the mean (n = 8) mice per group. Pooled data from two (A–D) or three (E) independent experiments. ns = p ≥ 0.05, *p < 0.05, **p < 0.01, ***p < 0.001, ****p < 0.0001 by one-way ANOVA followed by Tukey test (B, D, and E).

