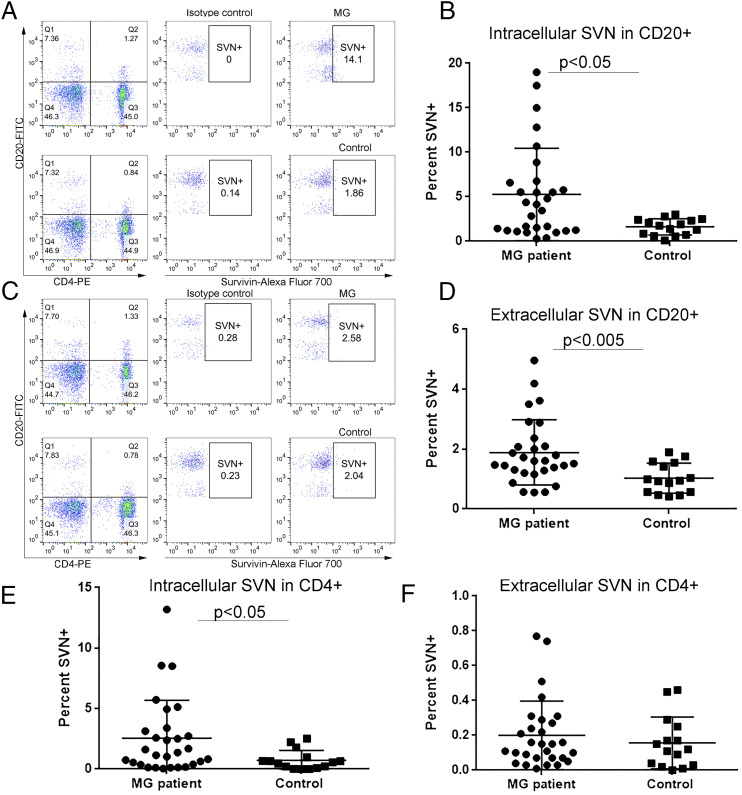
FIGURE 1.
Intracellular and extracellular localization of survivin in PBMCs from MG patients. MG patients (n = 29) and controls (n = 15) were assessed for survivin expression by FACS analysis. Samples were viewed on a BD FACSCelesta analyzer, and survivin+ lymphocytes were determined by FlowJo. (A) Representative dot plots of intracellular survivin staining from one PBMC sample from MG patient (top) and control (lower) are shown. The area to determine the percentage positive CD20 and survivin cells is shown. (B) The graph depicts the percentage of CD20+ cells that were positive for intracellular survivin staining in MG patients and controls. (C) Representative dot plot of extracellular staining from one PBMC sample from MG patient (top) and control (lower). (D) The graph of extracellular localization of survivin in CD20+ cells from MG patients and controls. (E) The percentage CD4+ cells with intracellular localization of survivin from MG patients and controls. (F) The graph of extracellular expression on CD4+ cells from MG patients and controls. The data are representative of two independent experiments expressed as mean values. Mann–Whitney U test was used to determine statistical significance. A p value <0.05 was considered significant.

