FIGURE 3.
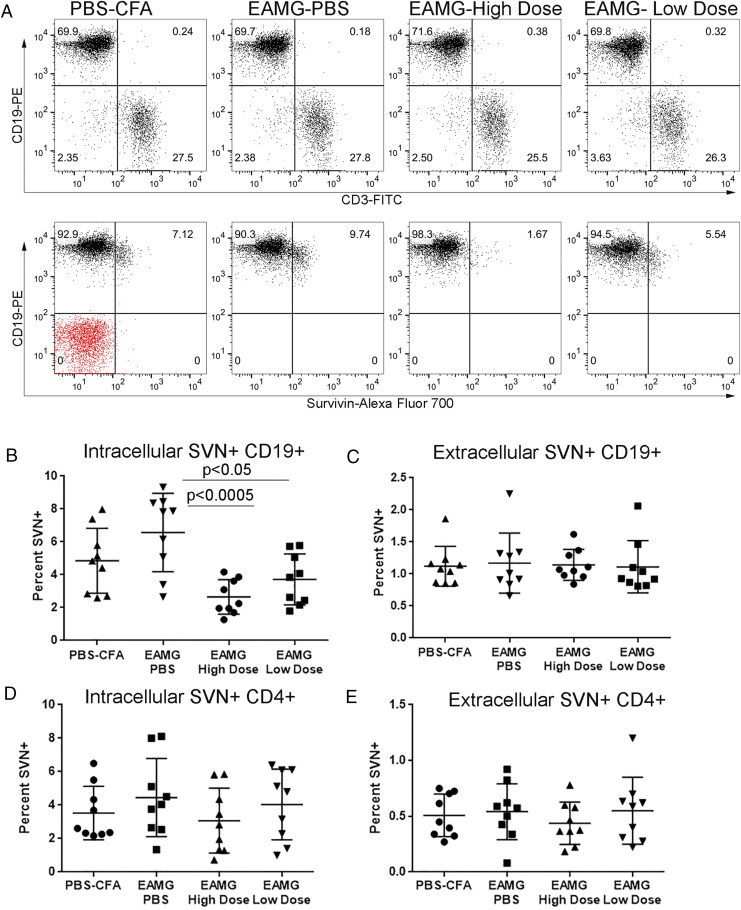
Splenocytes from 2C2-treated EAMG animals demonstrate a lower percentage of CD19+ survivin+ cells. Splenocytes were excised from treated animals on day 67. Cells were stained for viability, CD3, CD4, and CD19 markers. Cells were permeabilized and stained for survivin. For extracellular staining of survivin, the permeabilization step was omitted. Samples were viewed on a BD FACSCelesta analyzer, and survivin+ cells were determined by FlowJo. (A) Representative dot plot from PBS–CFA (control), and EAMG animals (PBS treated, high-dose anti-survivin, and low-dose anti-survivin) are shown. (B) Scatter plot of all samples analyzed for intracellular survivin+ CD19+ cells. (C) Percentage of CD19+ cells that demonstrated extracellular survivin. (D) Graph of the percentage of CD4+ cells that contained intracellular survivin. (E) The percentage of CD4+ cells that showed extracellular localization of survivin. Data were presented as mean ± SD. Results were representative of two independent experiments. n = 9 for all groups. Statistical analysis was done by Student t test. Statistical p values < 0.05 were considered significant.

