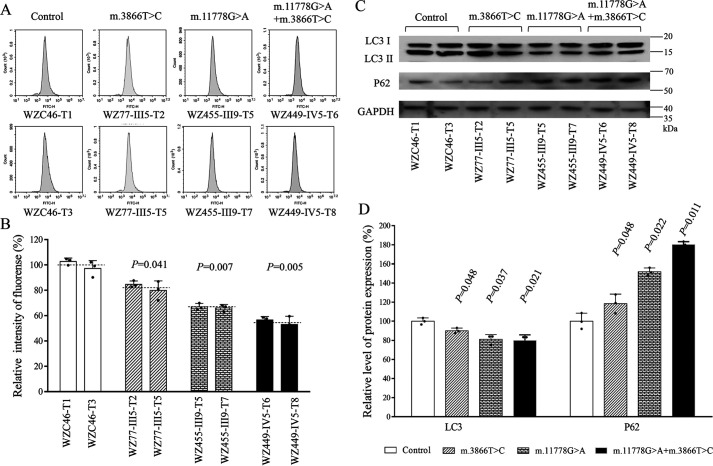
Figure 9.
Analysis of mitophagy. A, flow cytometry histograms showing fluorescence of 6 mutant and 2 control cybrids using a CYTOID® autophagy detection kit. Cells were incubated with DMEM in the absence and presence of rapamycin (inducers of autophagy) and chloroquine (lysosomal inhibitor) at 37 °C for 18 h, added to CYTO-ID®-Green dye, and analyzed using a Novocyte flow cytometer (ACEA Biosciences). B, relative fluorescence intensity from various cell lines. Three independent determinations were done in each cell line. C, Western blot analysis for mitophagic response proteins LC3-I/(I+II) and P62. Twenty micrograms of total cellular proteins from various cell lines was electrophoresed, electroblotted, and hybridized with LC3 and p62, with GAPDH as a loading control. D, quantification of autophagy markers LC3 I/II and p62 in mutant and control cell lines, determined as described elsewhere (19). Four independent determinations were done in each cell line. Graph details and symbols are explained in the legend to Fig. 1.

