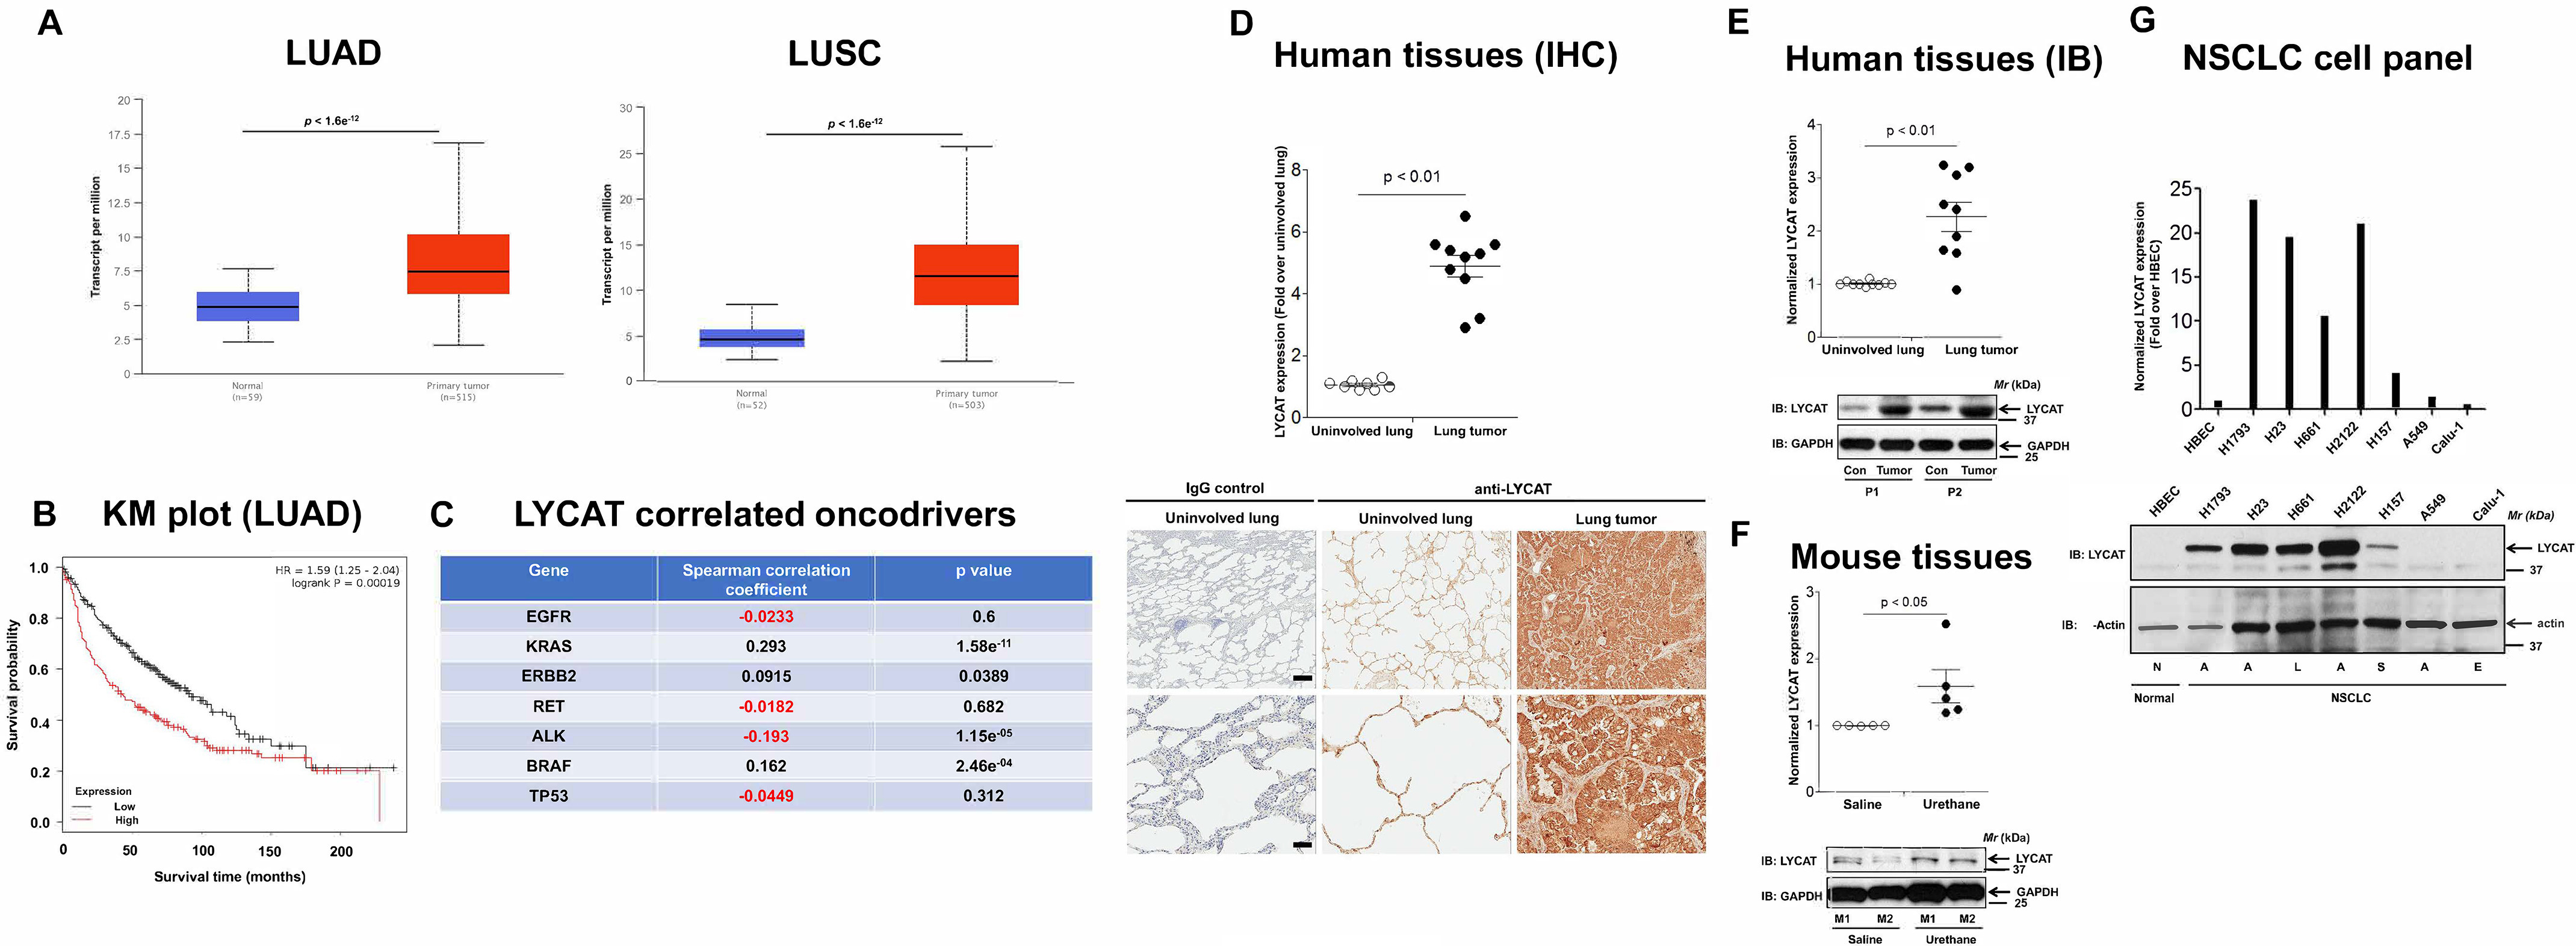
Figure 1.

Expression of LYCAT is increased in lung cancer. A, bioinformatics analysis of TCGA lung cancer data sets showed increased LYCAT expression in LUAD and LUSC. B, Kaplan–Meier survival curves for patients with high and low LYCAT expression were determined using an online tool (KM Plotter). p values were calculated by log-rank test. For these studies, 274 low- and 186 high-LYCAT–expressing patient samples from TCGA, which are separated by their median values, were employed. C, Spearman correlation studies to determine the LYCAT-correlated oncodrivers in lung cancer by using cBioPortal. D, immunohistochemical (IHC) staining of FFPE sections of human lung tumors and adjacent uninvolved lung tissues from the same patients with LYCAT antibodies. Top, staining intensities; bottom, representative pictures. **, p < 0.01. Scale bar, 500 μm. E, expression of LYCAT in fresh-frozen human lung cancer tissues and adjacent uninvolved lung tissues as detected by immunoblotting (IB) with anti-LYCAT and anti-GAPDH antibodies. F, expression of LYCAT in chemical carcinogen (urethane)-induced mouse lung tumors was determined by immunoblotting (IB) with anti-LYCAT antibodies. G, expression of LYCAT in human nontransformed bronchial epithelial cells (HBEC) and a panel of NSCLC cell lines. N, normal; A, adenocarcinoma; S, squamous carcinoma; L, large-cell carcinoma; E, epidermoid carcinoma.
