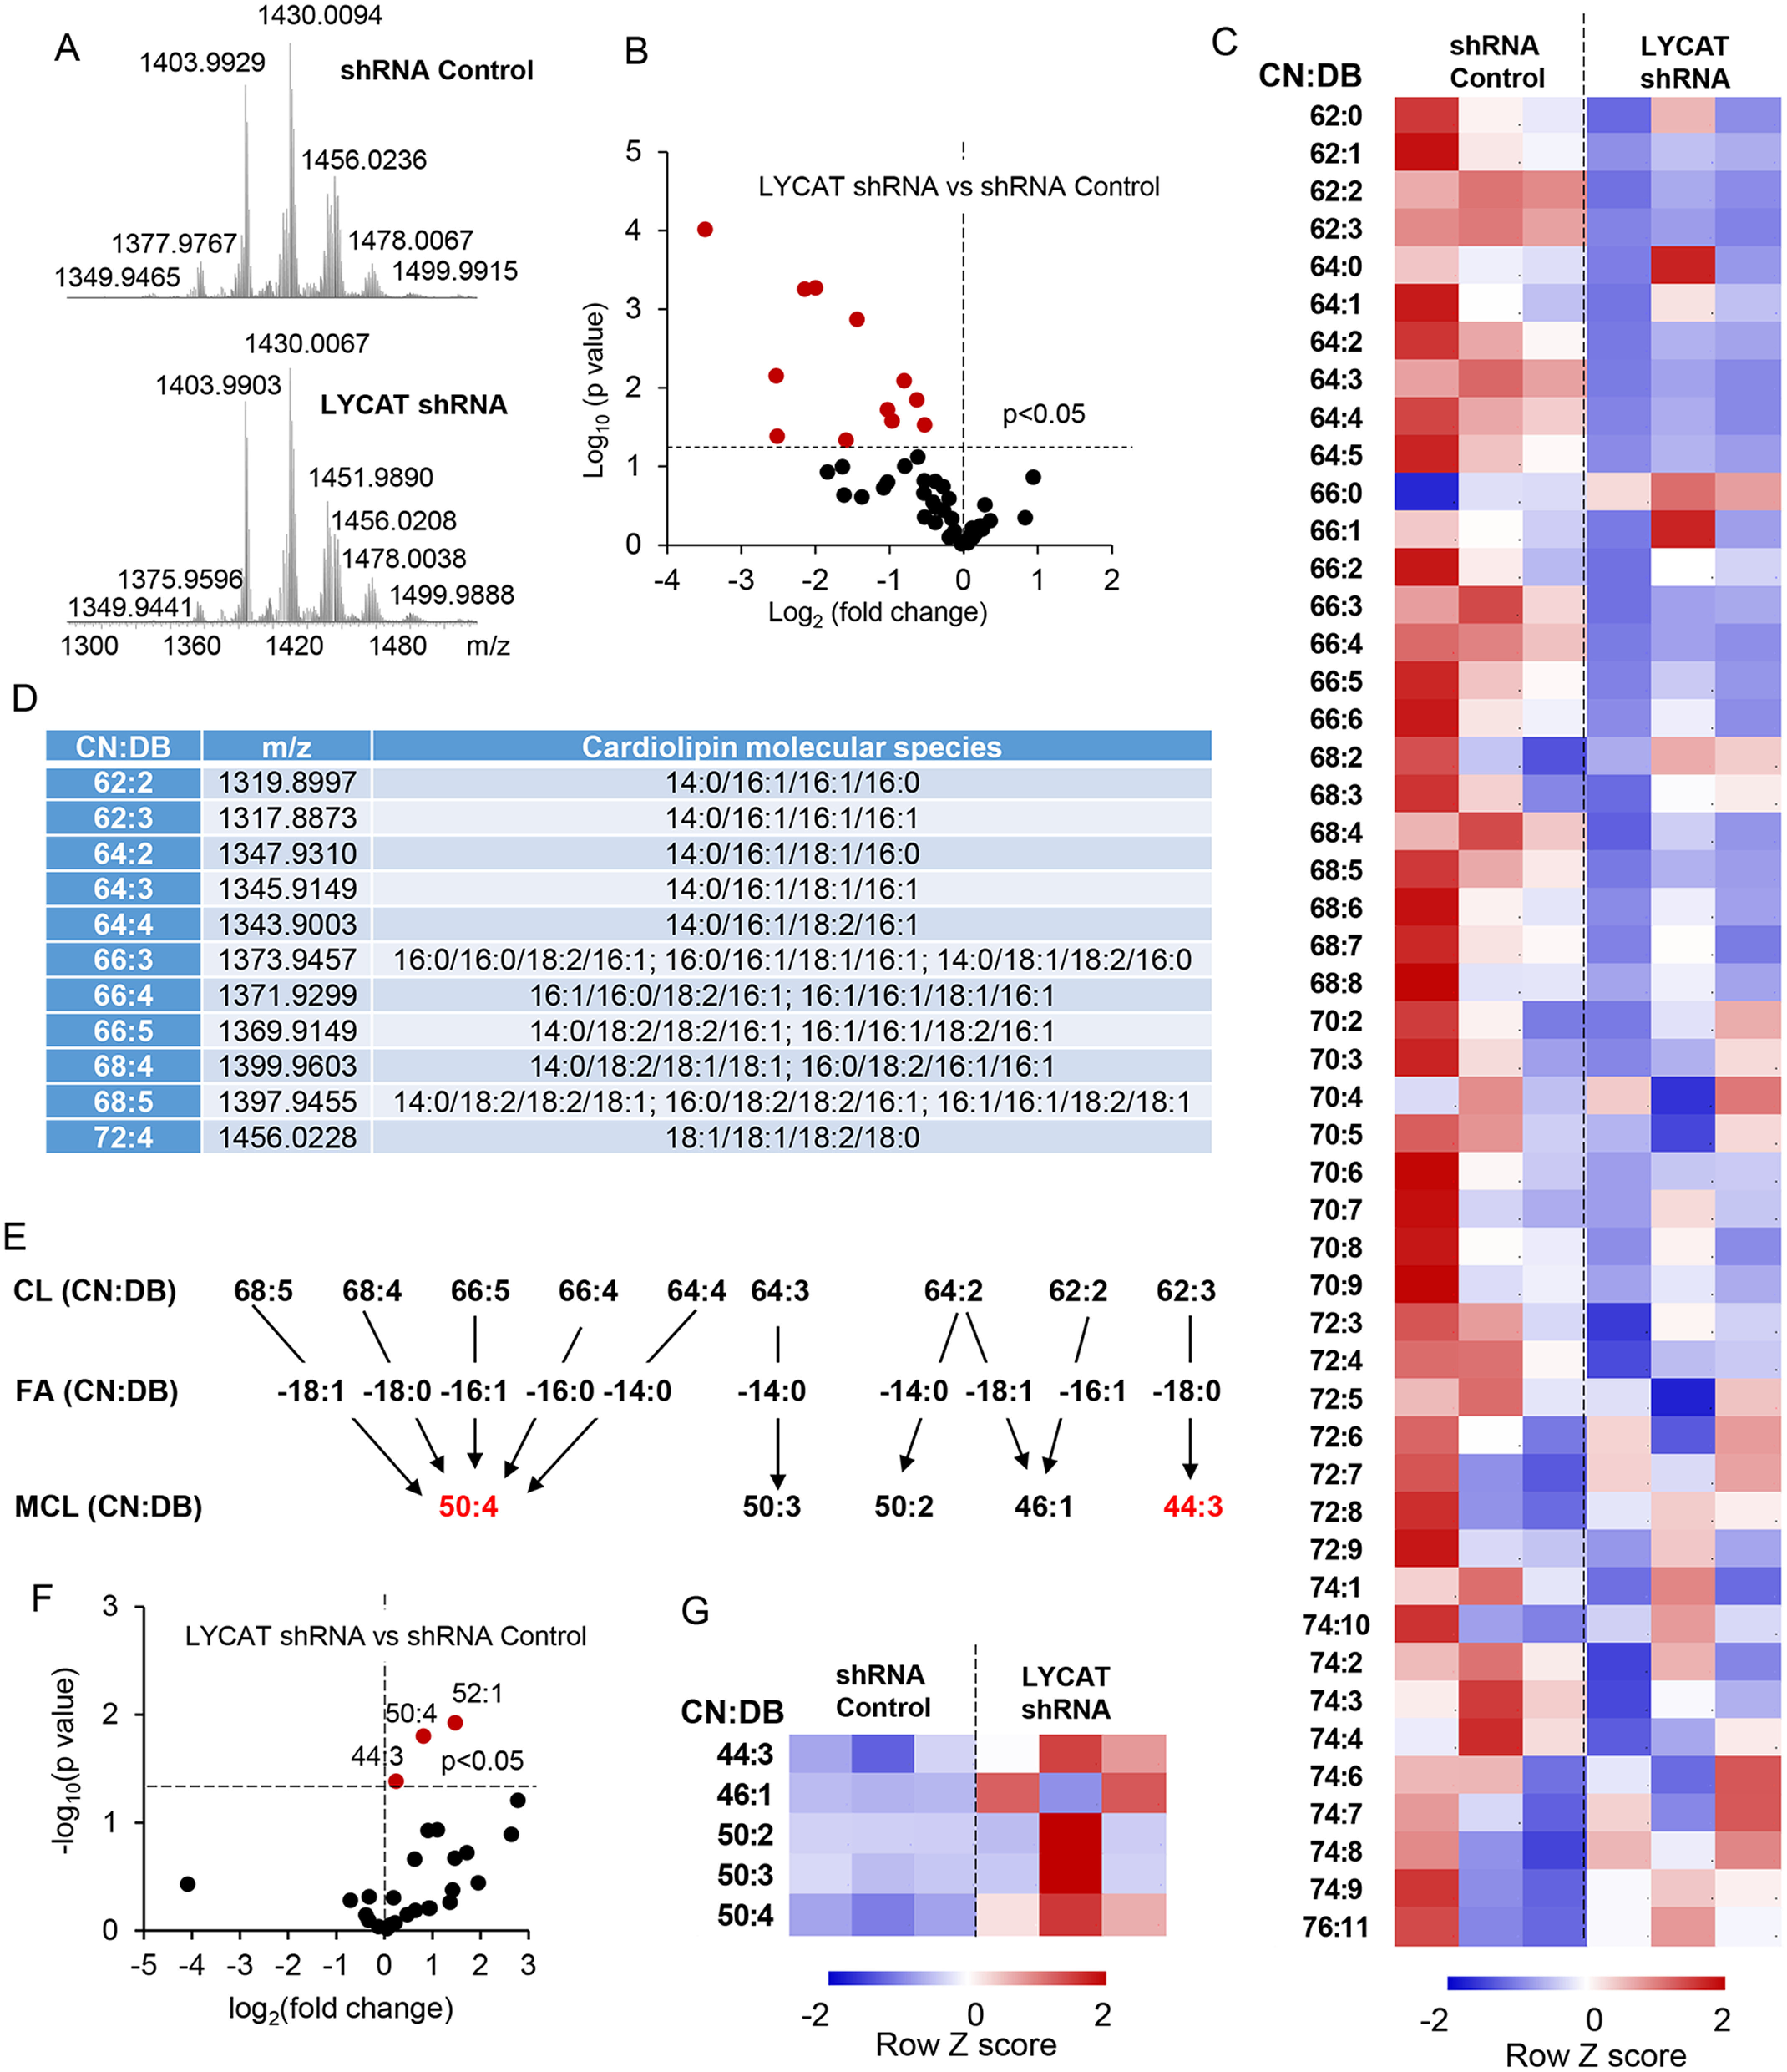
Figure 4.

LYCAT knockdown–induced changes in CL and MCL levels. A, typical spectra of CL obtained from H23 cells. B, volcano plot of LYCAT shRNA–induced changes in CL (log2(-fold change)) versus significance (log10 p value). C, the contents of CL in H23 cells. The data are presented as heatmaps, autoscaled to z-scores, and coded blue (low values) to red (high values). D, CL molecular species that were significantly changed in LYCAT shRNA–treated cells. E, schema illustrating hydrolysis of parent CLs to yield detected MCLs. F, volcano plot of LYCAT shRNA–induced changes in MCL (log2(-fold change)) versus significance (log10 p value). G, the contents of MCL in H23 cells. The data are presented as heatmaps, autoscaled to z-scores, and coded blue (low values) to red (high values). CN, carbon number; DB, double bond.
