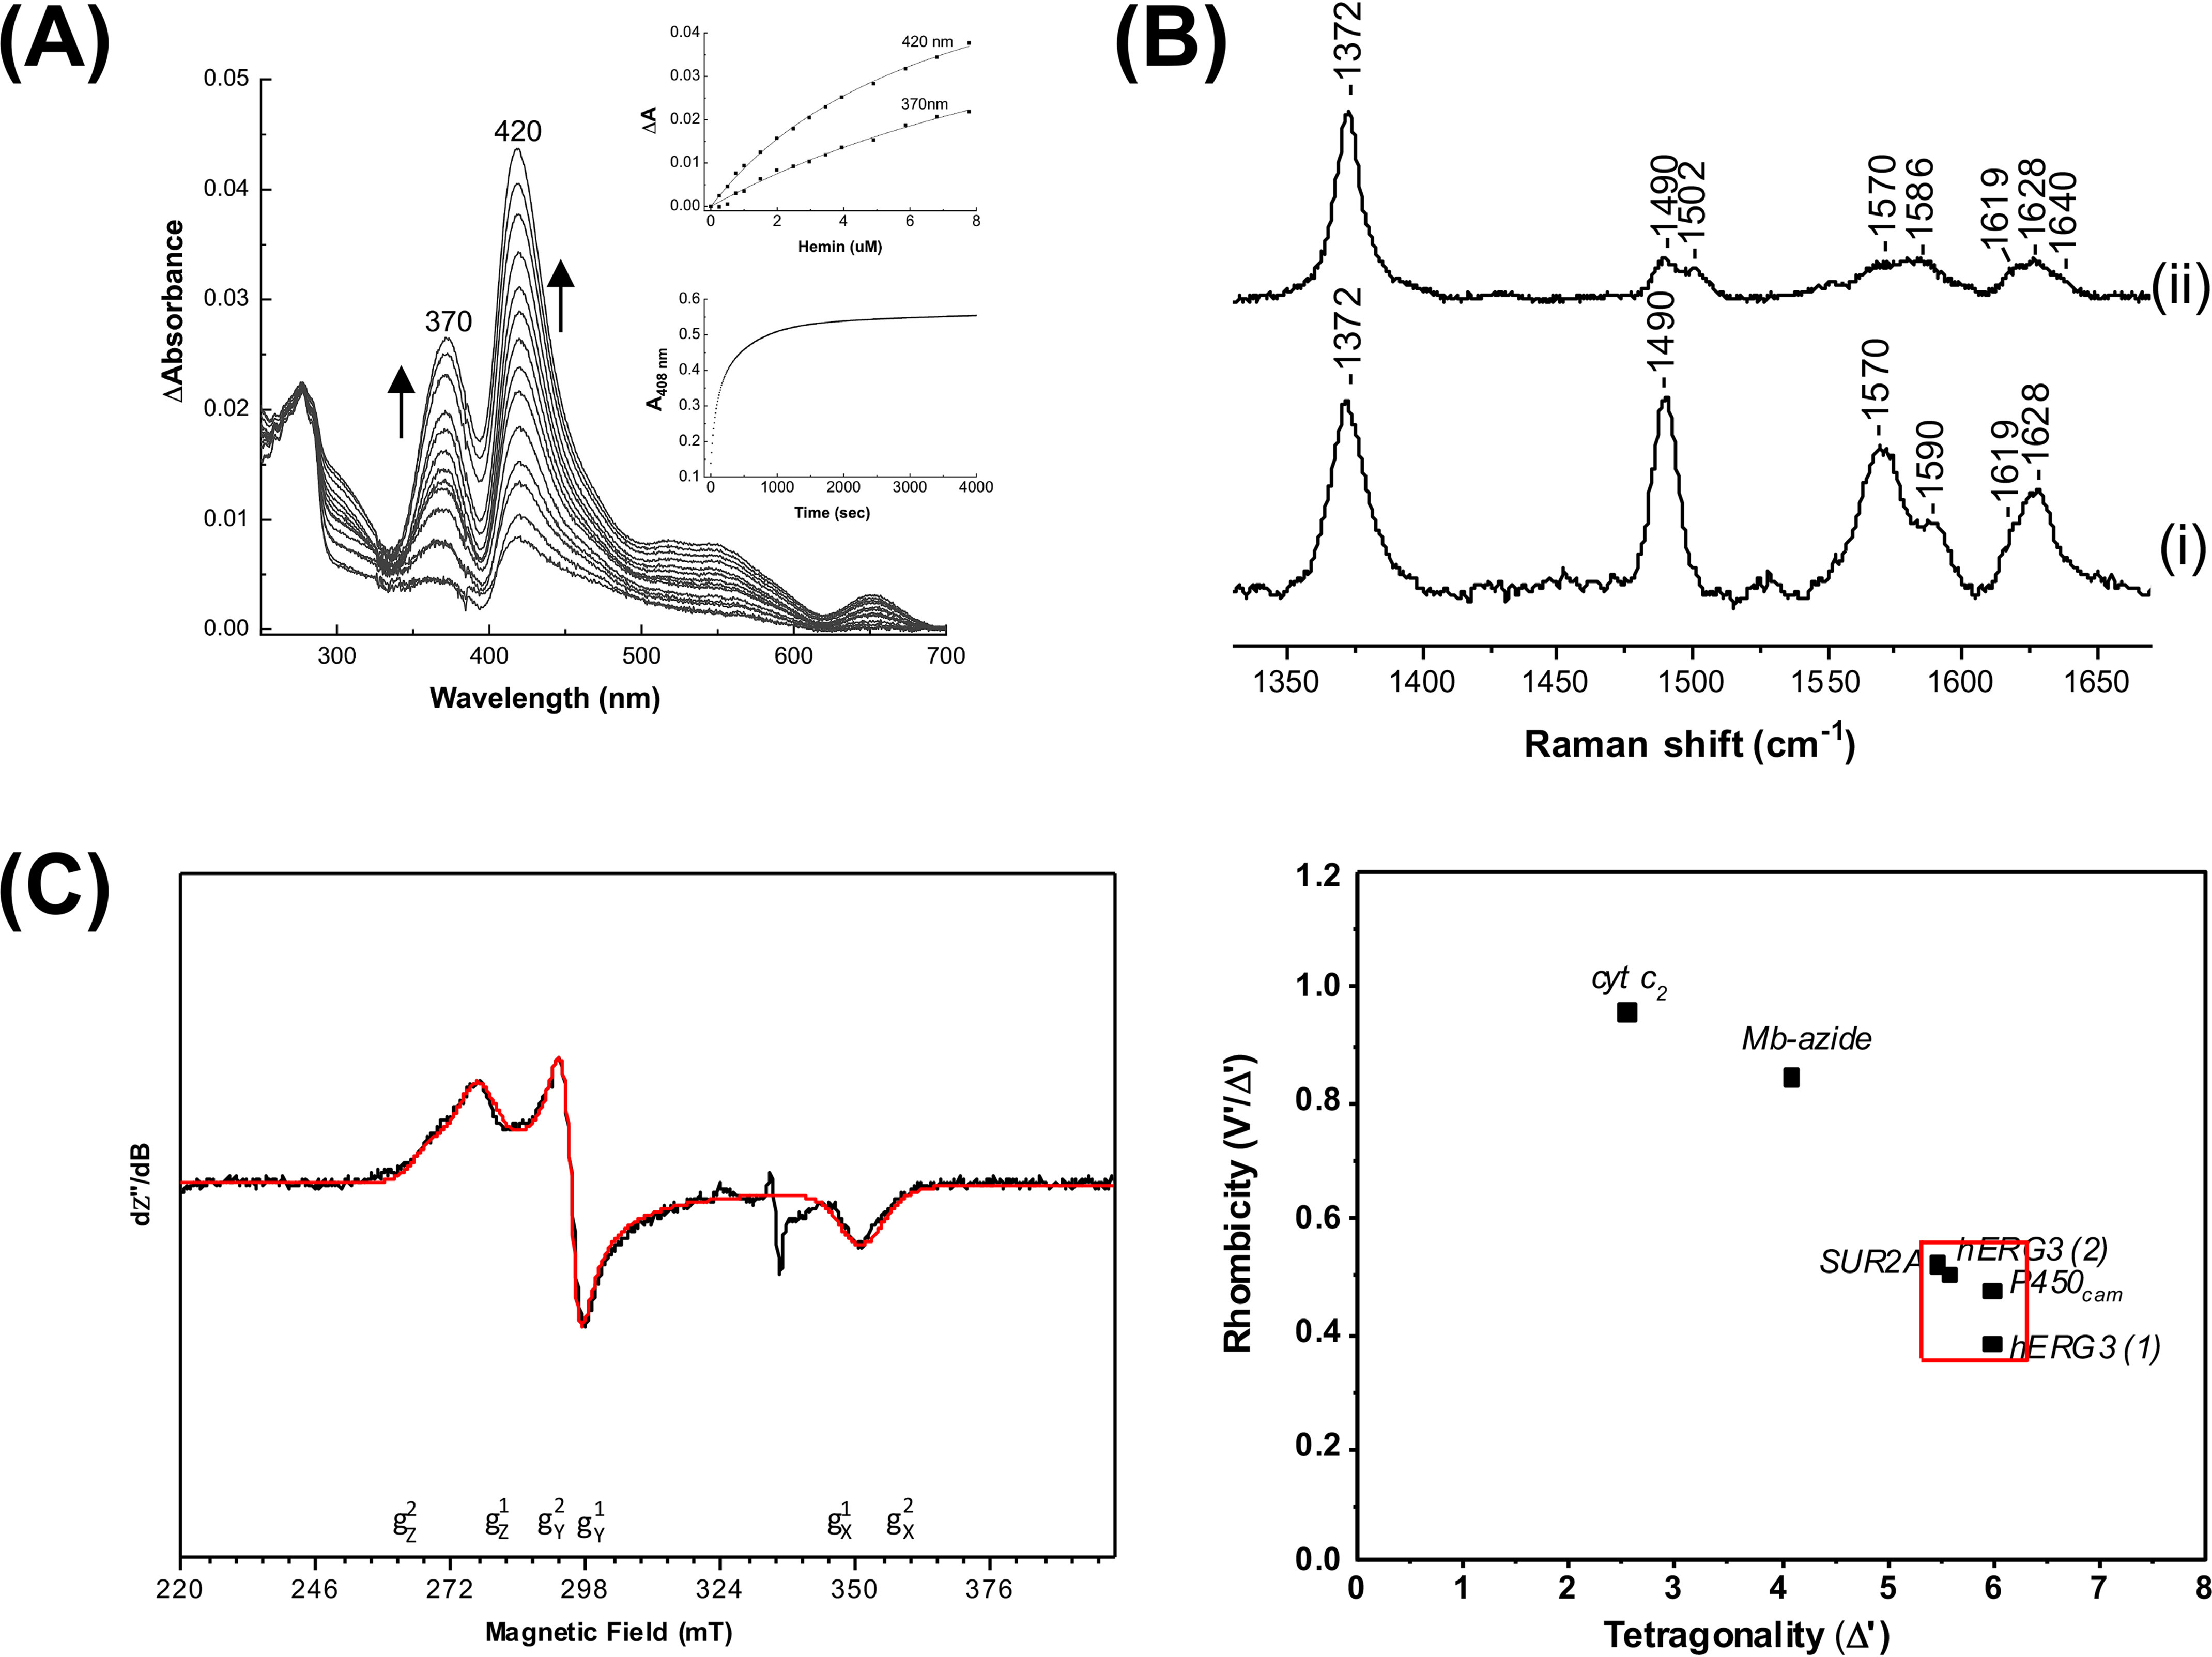
Figure 2.

Analysis of heme binding to the hERG3-eag domain. A, difference spectra obtained on titration of the hERG3-eag domain with ferric heme; the arrows represent the directions of the absorbance changed with increasing heme concentration. Inset, top panel, hyperbolic fitting of the heme-binding data at both wavelength maxima to a 1:1 model for heme binding. Inset, bottom panel; absorbance changes at 408 nm on binding of the ferric hERG3-eag complex to apo-myoglobin. The data were fitted to the first order decay process, yielding kobs = 0.03 s−1. B, room temperature high-frequency resonance Raman spectra of free heme (panel (i)) and the ferric hERG3-eag–heme complex (panel (ii)). All spectra were collected with 413.1-nm laser excitation. C, left panel, X-band EPR spectrum (black trace) of the ferric hERG3-eag–heme complex in the low-spin region along with the simulated spectrum (red trace). The experimental conditions were as follows: microwave frequency, 9.38 GHz; microwave power, 0.064 mW; field modulation amplitude, 2 mT; field modulation frequency, 100 kHz; temperature, 15 K; [heme] = 100 μm, 5-fold excess of protein in 50 mm HEPES buffer, pH 7.5, 50 mm NaCl. The simulation parameters are as follows: species 1 (75%) g values (g strain) are gz1 = 2.42 (0.06), gy1 = 2.27 (0.00), and gx1 = 1.91 (0.04); species 2 (25%) g values (g strain) are gz2 = 2.50 (0,07), gy2 = 2.28 (0.00), and gx2 = 1.90 (0.06); Lorentzian linewidth full-width at half-maximum 4 mT. Right panel, Blumberg–Peisach correlation diagram showing EPR parameters plotted for various heme proteins.
