Figure 5.

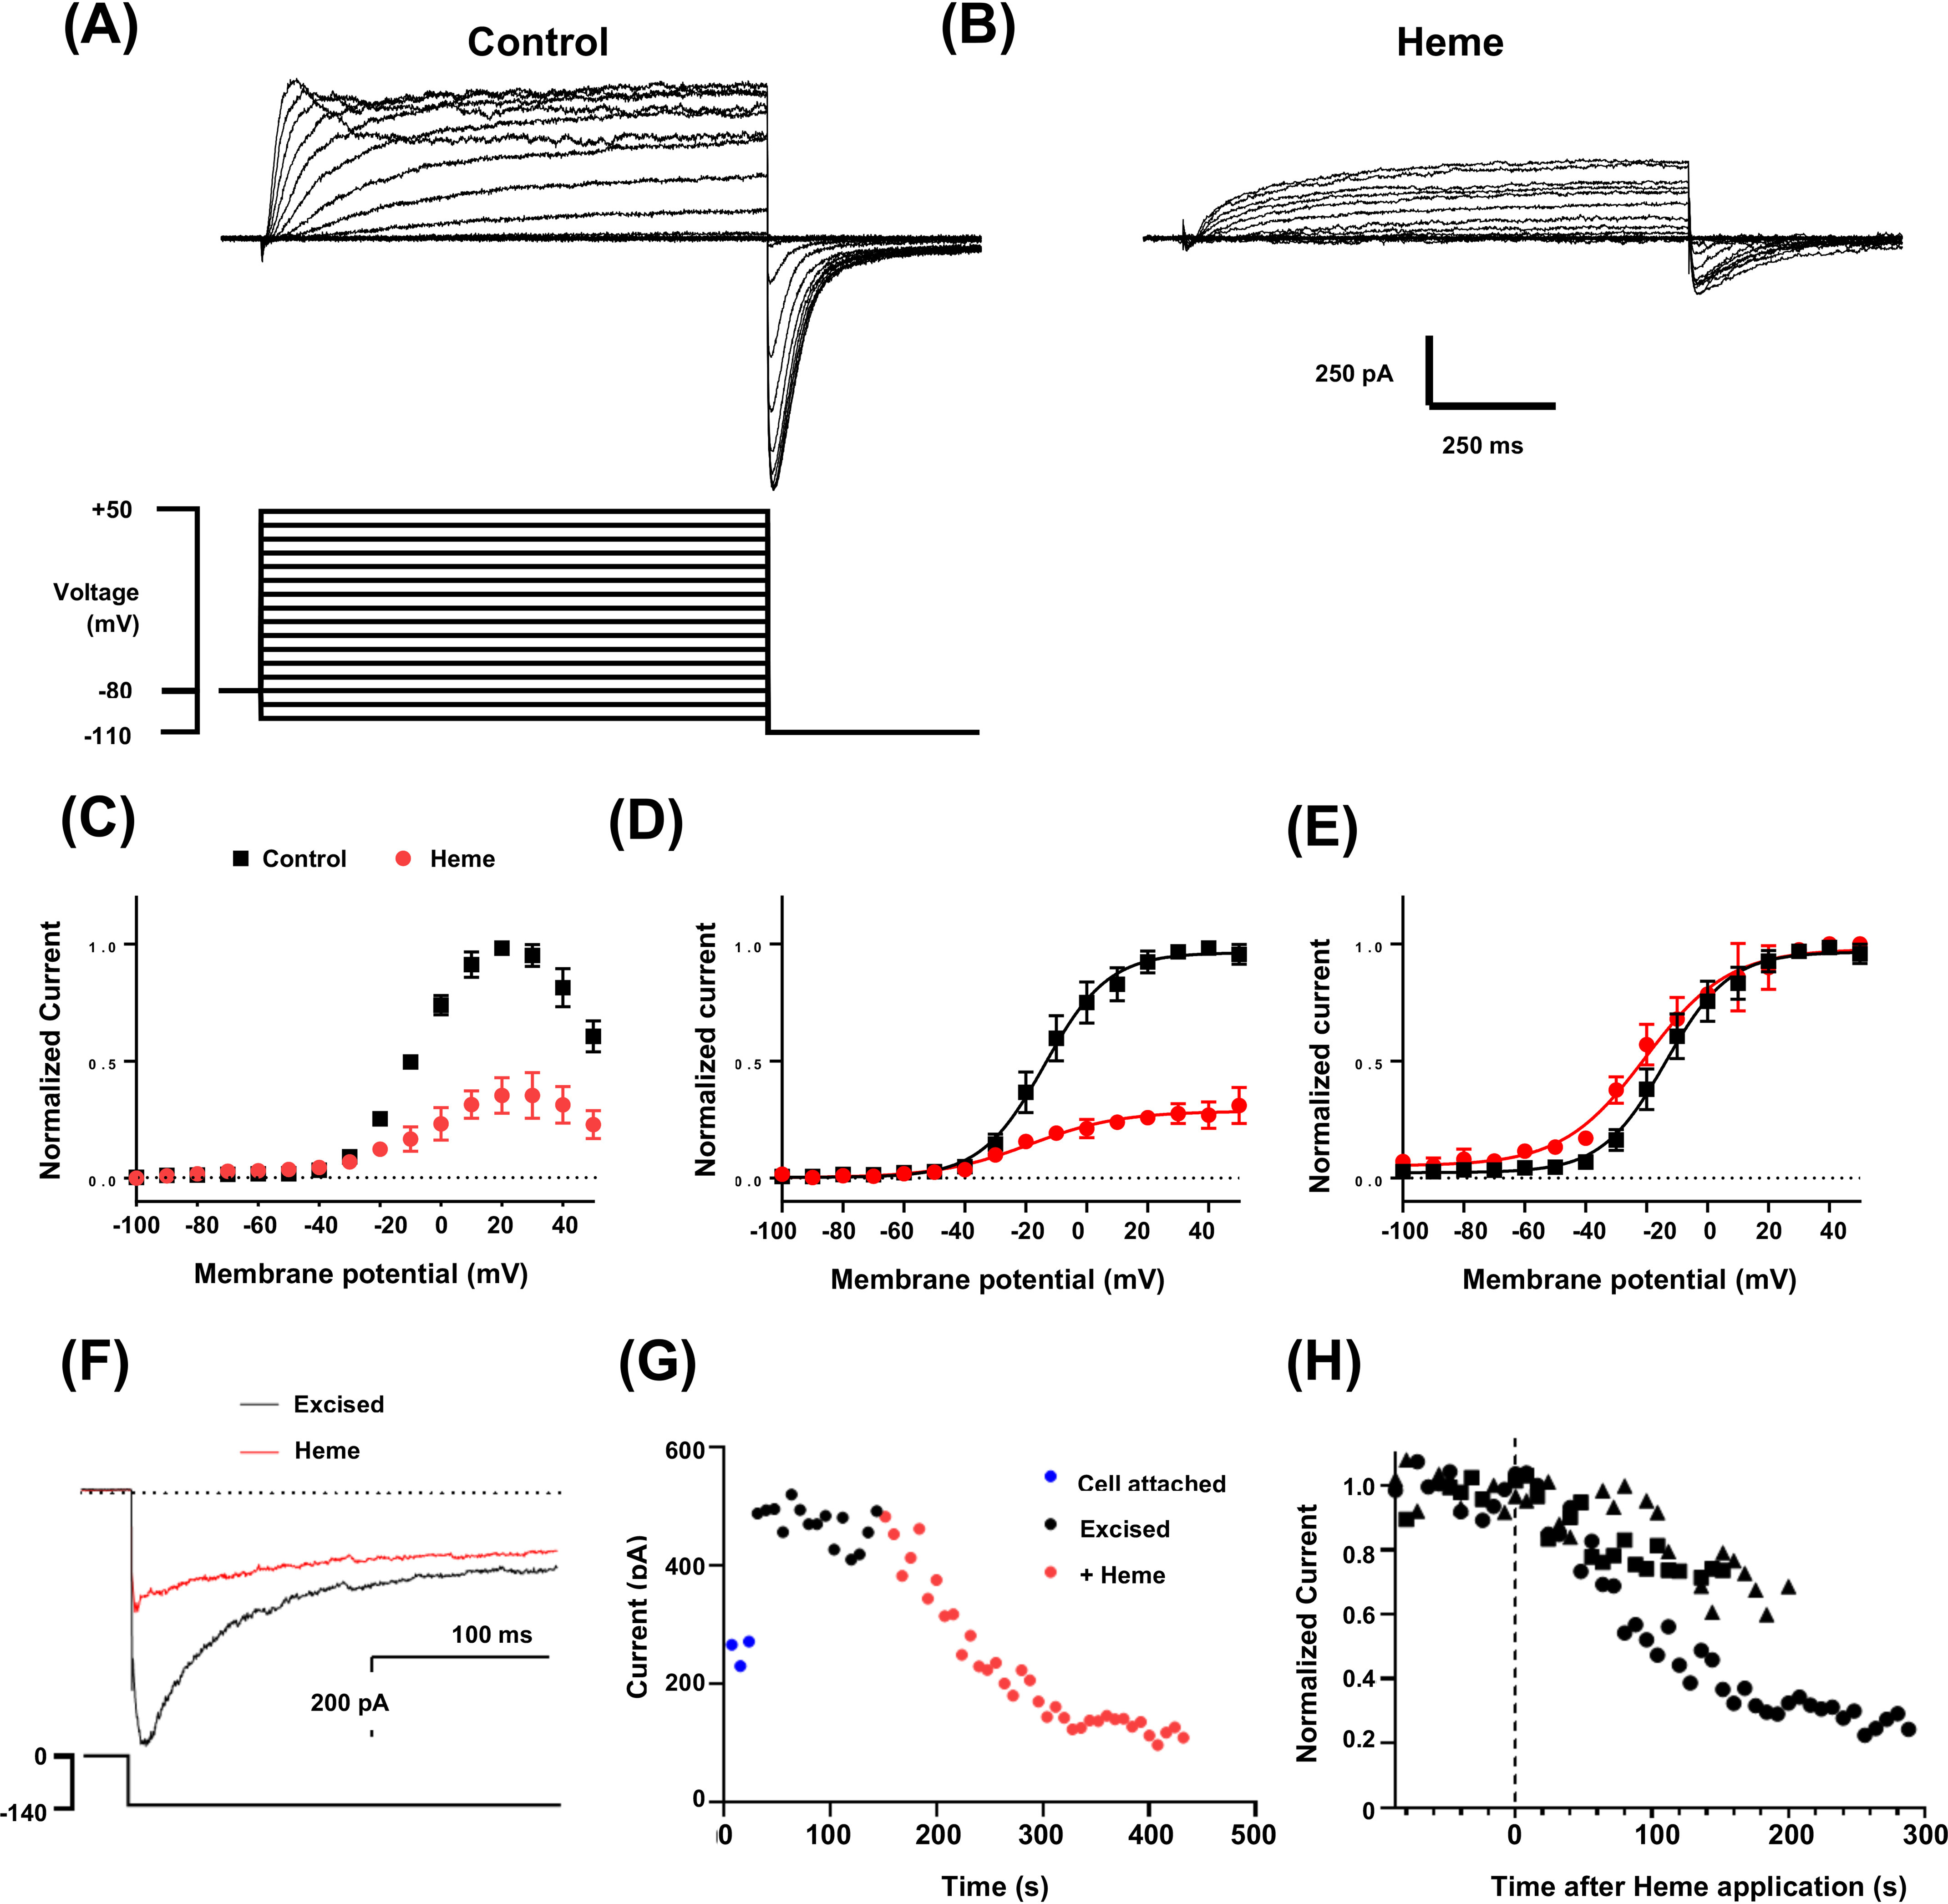
hERG3 currents are inhibited by heme. A, representative whole-cell hERG3 currents (upper panel) elicited with voltage protocol (lower panel) consisting of 1-s test pulses from −100 to +50 mV in 10-mV increments and from a holding potential of −80 mV. Inward tail currents were measured at a potential of −110 mV. The start-start interval for the voltage protocol was 5 s. B, a family of hERG3 current traces from the same cell shown in A after superfusion of heme (500 nm). C, mean end-pulse current-voltage relationship with and without heme (500 nm) (n = 3). D and E, mean tail current (normalized to maximum control current in individual cells (D) or normalized to maximum current (E) in each recording solution) and plotted against test-pulse potential, with and without heme (500 nm) (n = 3). The data are fitted with Boltzmann functions (solid lines). Half-maximal activation (V0.5) and slope factor were −12.3 ± 4.7 mV and 10.7 ± 1.0 mV, respectively, before heme and −19.0 ± 4.4 mV and 14.1 ± 2.6 mV with heme (n = 3). F, representative traces of excised inside-out macro-patch recordings of hERG3 tail currents before and during application of heme (1 μm). Patches were excised into solutions containing 10 μm phosphoinositol 4,5-bisphosphate to attenuate current rundown. Intracellular and extracellular solutions contained equimolar K+ concentrations. Tail currents were measured at a potential of −140 mV and following 2-s test pulses to 0 mV (see voltage protocol in lower panel). Horizontal dotted lines in D–F indicate zero current. G, representative plot of changes in amplitude of the deactivating component of the tail current plotted against time. The time between traces was 8 s. H, scatter plot of hERG3 tail current amplitudes in three separate excised patches plotted against time after heme application. The time of heme application is indicated by the vertical dashed line.
