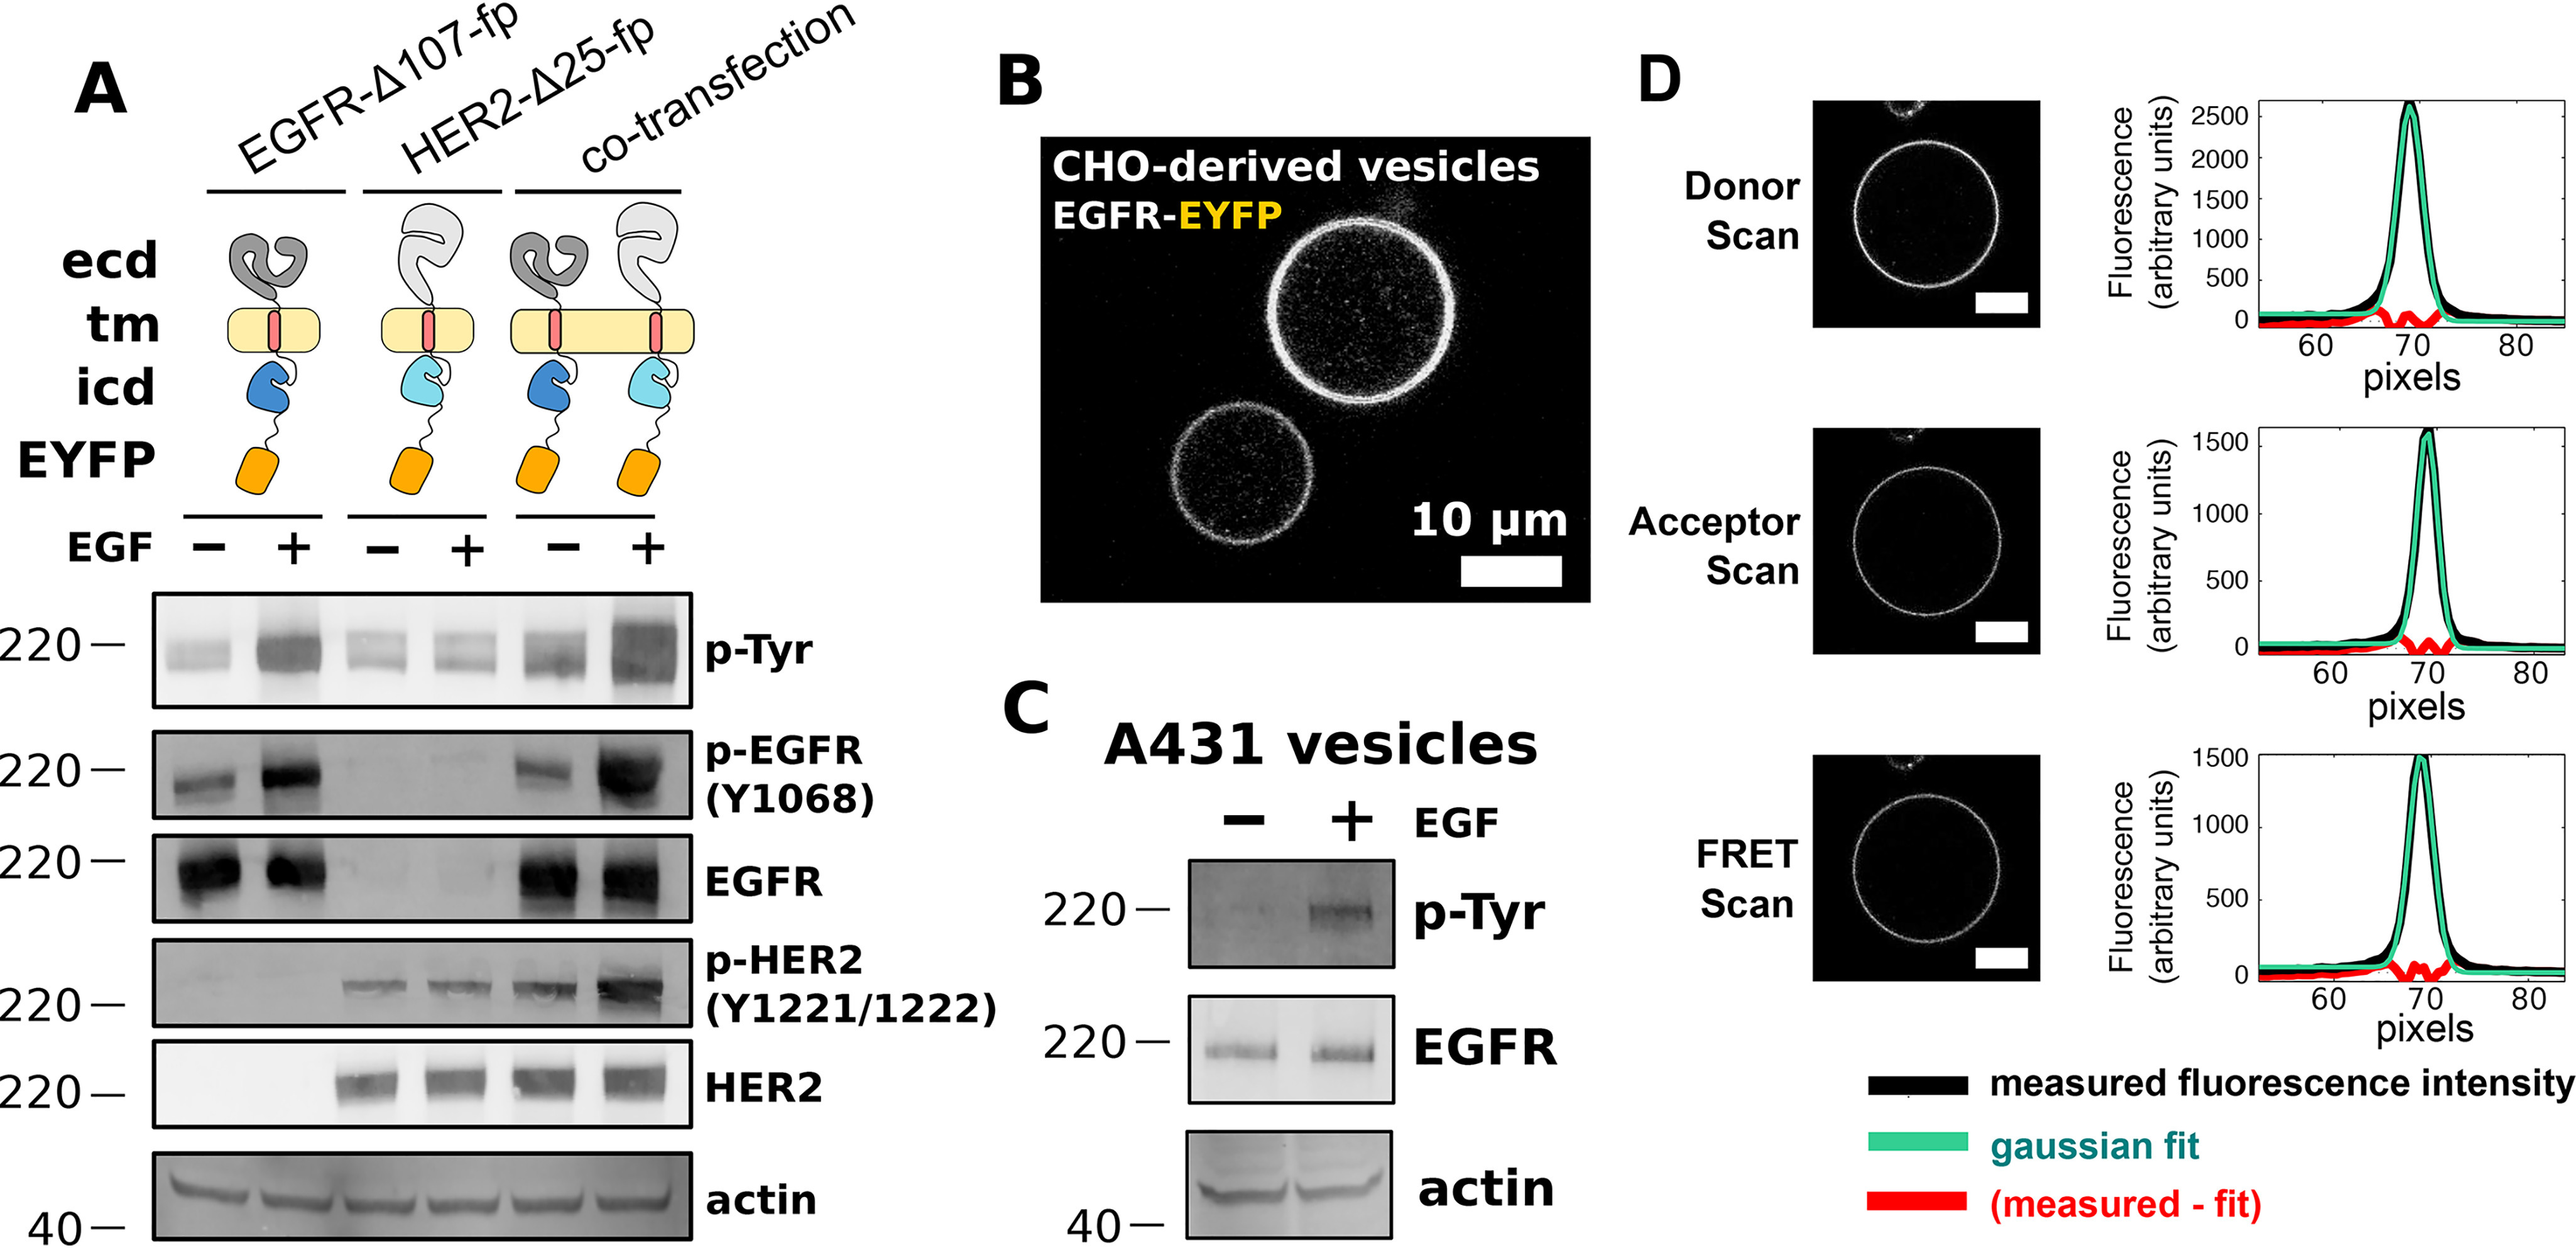
Figure 1.

FRET microscopy of near full-length EGFR and HER2 in CHO cell vesicles. A, Western blot analysis of transient expression and EGF-dependent phosphorylation of EGFR-Δ107-FP and HER2-Δ25-FP in CHO cells. Blots are representative of three independent experiments. Primary antibodies are indicated at the right of each blot. ICD = intracellular domain, pTyr = phosphotyrosine. B, confocal image of two vesicles derived from the plasma membranes of CHO cells expressing EGFR-EYFP. Scale bar = 10 μm. C, Western blot analysis of EGFR in vesicles derived from A431 cells. EGFR becomes phosphorylated in response to EGF in the presence of ATP. D, representative scans for a FRET experiment. Scale bars = 10 μm. Plots to the right of each vesicle image show the average fluorescence intensity (y axis) as a function of radius from the center of the vesicle (x axis, in units of pixels). Molecular mass markers (kDa) are indicated to the left of each Western blot.
