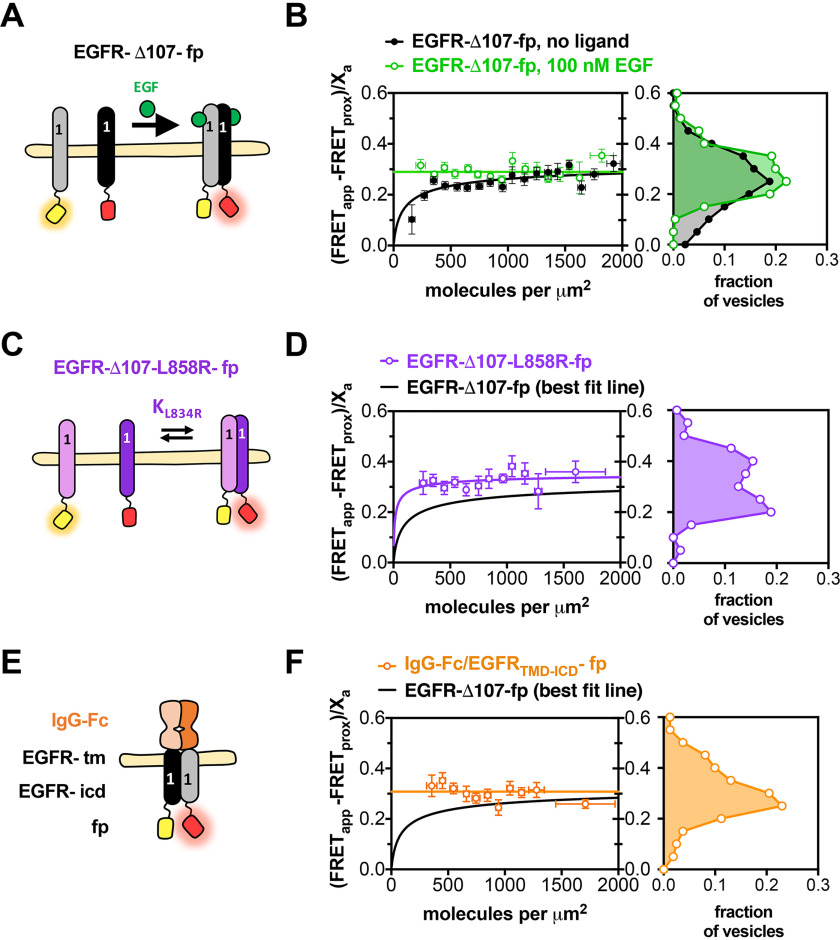
Figure 2.
Near full-length EGFR forms ligand-independent oligomers at physiological plasma membrane concentrations. FRET efficiency for EGFR-Δ107-fp homo-oligomers. A, C, and E, cartoon representations of fluorescent-protein-linked (A) EGFR WT, (C) L858R, and (E) IgG-Fc/EGFR. B, D, and F, FRET efficiency plots for (B) EGFR-Δ107-fp WT, (D) L858R and (F) IgG-Fc/EGFR. Each panel in B, D, and F contains two graphs. The graph on the left shows the FRET efficiency ((FRETapp − FRETprox)/Xa)) (y axis) as a function of concentration (x axis). The data in B, D and F were projected onto the y axis to yield FRET histograms, plotted at the right. FRETapp is the apparent FRET efficiency, FRETprox is the theoretical FRET efficiency that results from nonspecific interactions, and Xa is the fraction of acceptor molecules in a given vesicle. Binned data points are shown as circles. Error bars represent the S.E. in x and y. The best fit to a monomer-dimer equilibrium model is represented by solid lines. B, data for EGFR-Δ107-fp in the absence (black) and presence (green) of 100 nm EGF. Each dataset was derived from at least three independent biological replicates. The number of vesicles per experiment ranged from 25 to 100.

