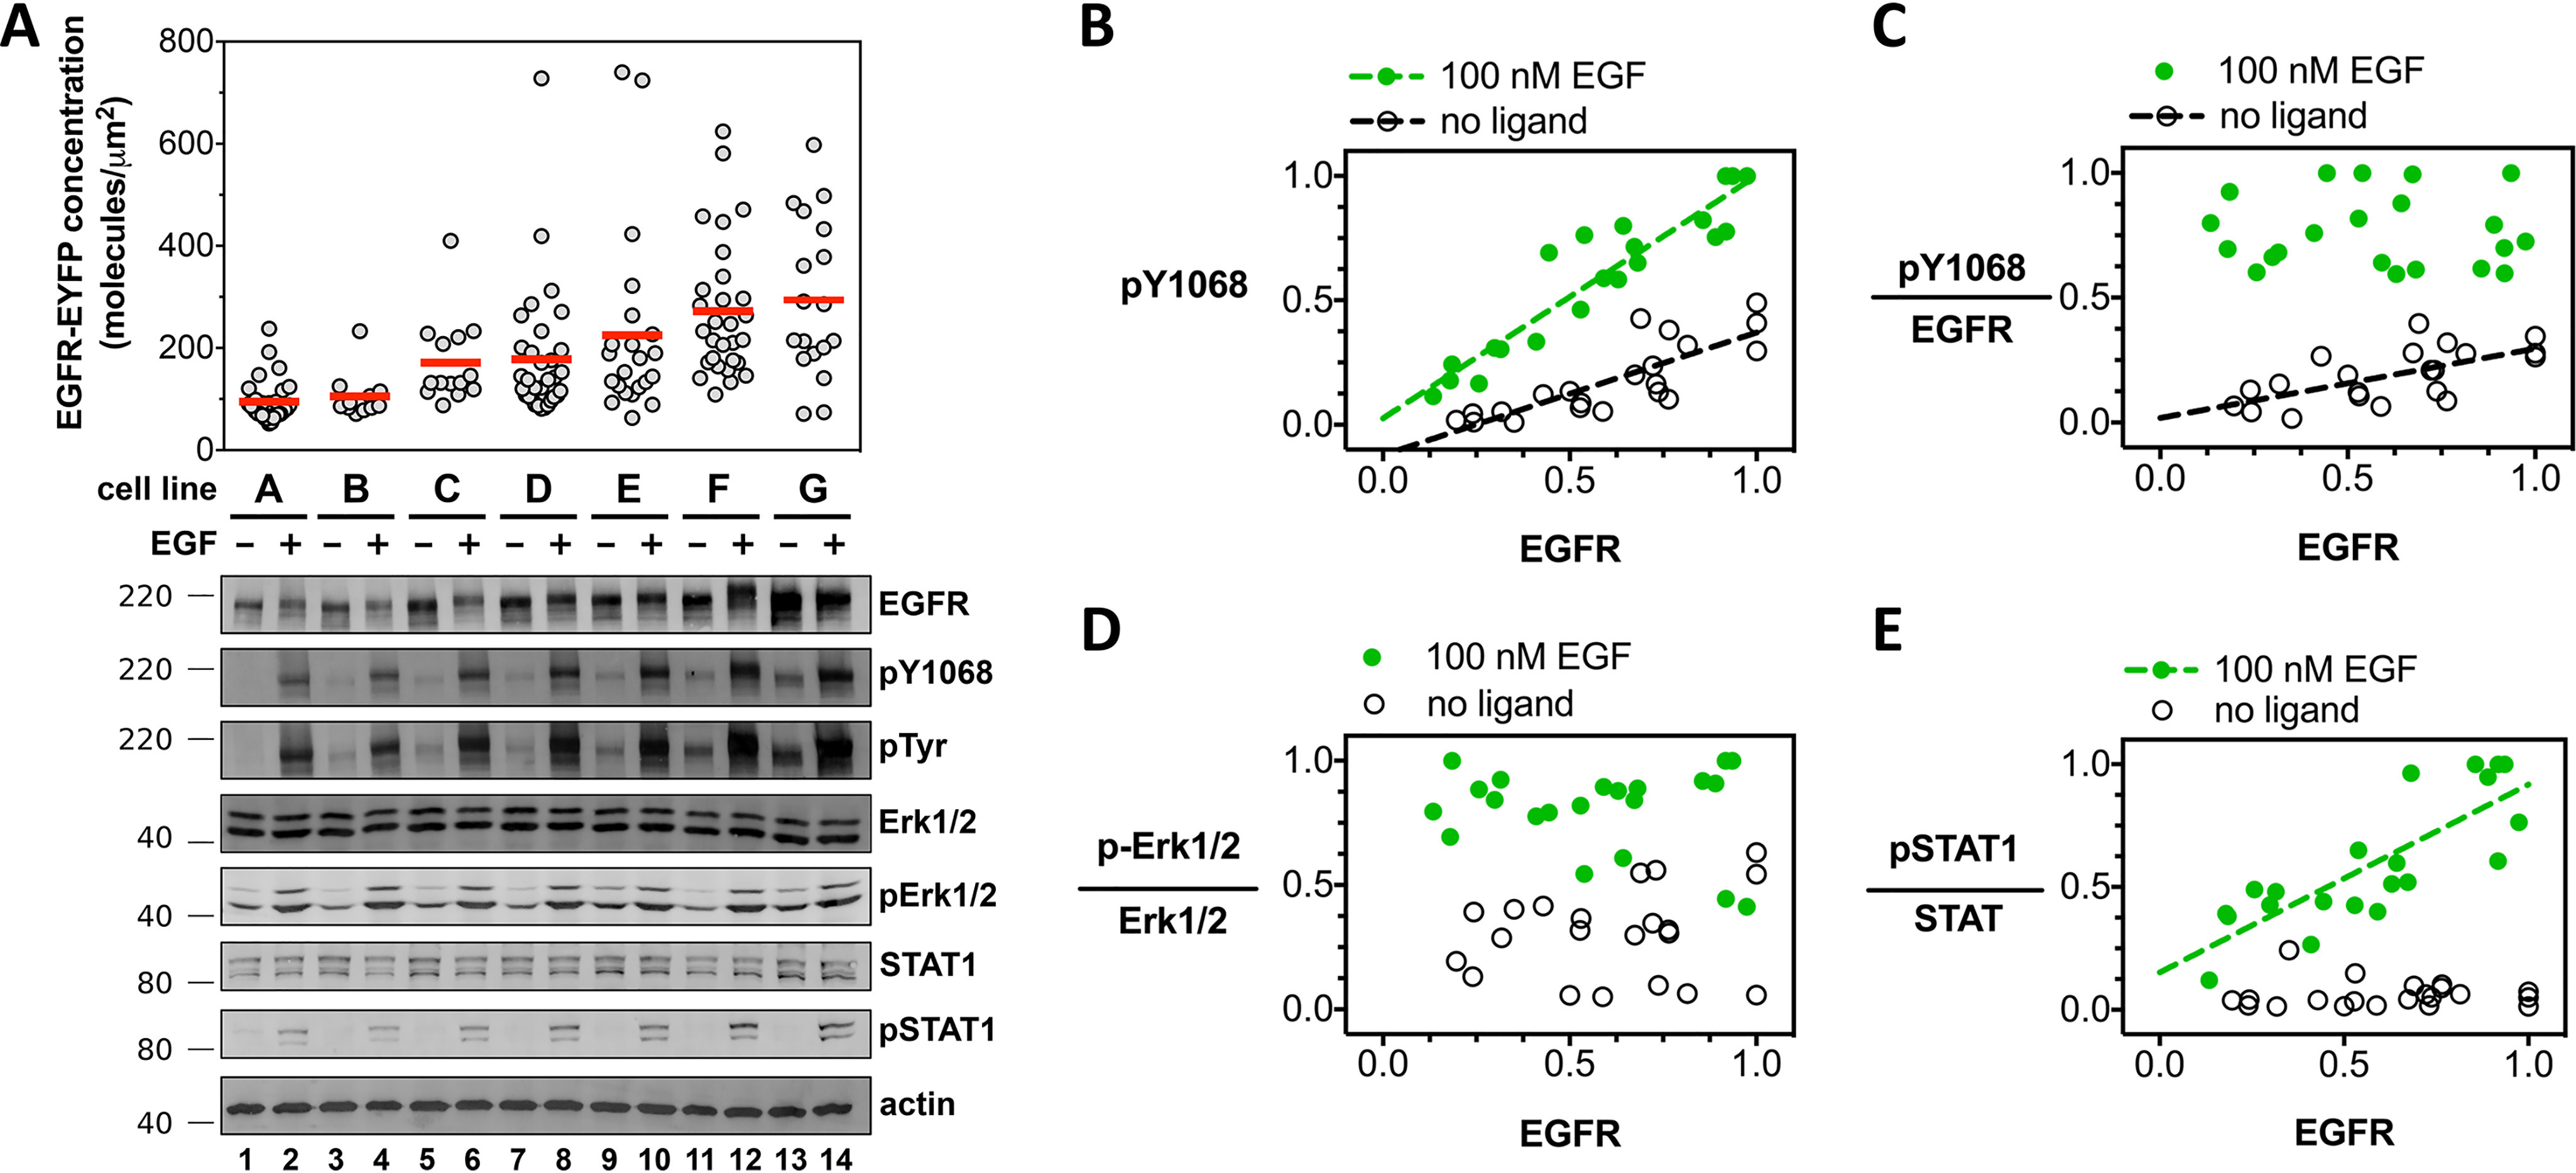
Figure 4.

Increased EGFR cell surface concentration correlates with increased EGFR phosphorylation but not increased effector phosphorylation in the absence of ligand. A, confocal microscopy and Western blot analysis of EGF-independent and EGF-dependent EGFR signal transduction. Measurements from seven unique CHO cell lines (cell line A, B, C,… G), each stably expressing full-length EGFR-EYFP. The concentration of EGFR-EYFP, determined by confocal microscopy, is plotted on the y axis. Each gray dot corresponds to a measurement from a single vesicle. Fluorescence data are representative of three independent biological experiments. Primary antibodies are indicated to the right of the Western blots, which are representative of three independent experiments. Molecular mass markers (kDa) are indicated to the left of each Western blotting. Each of the seven stable cell lines (A–G) were treated and analyzed in parallel for a single experiment. Selected Western blot groups were quantified in ImageJ and plotted in panels B–E. All values in panels B–E represent integrated band intensities, and the highest value within the experiment for a particular axis was normalized to equal a value of 1. Green circles depict bands from wells that were treated with 100 nm EGF, white circles represent bands from wells which were left untreated. Data were fit to a straight line. Slopes that deviated significantly from zero (p < 0.002) are shown as dashed lines. B, phosphorylated-EGFR (pY-1068) is plotted on the y axis, total EGFR level on the x axis. C, phosphorylated-EGFR (pY-1068) divided by total EGFR level plotted on the y axis; total EGFR level on the x axis. D and E, phospho-Erk1/2 (D) and phospho-STAT1 (E), divided by the signal for total ERK1/2 and STAT1 proteins, respectively, as a function of total EGFR. Molecular mass markers (kDa) are indicated to the right of each Western blot. Western blots are representative of three independent biological experiments, all of which are plotted in panels B–E.
