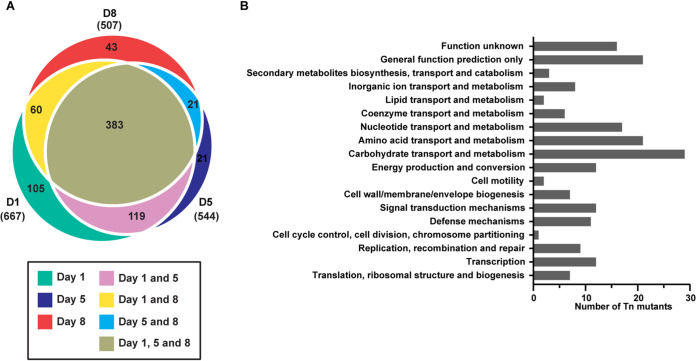
FIG 5.
Classification of transposon insertion mutants by COGs. (A) Euler plot representing number of underrepresented mutants at all time points. (B) COGs from underrepresented mutants common to all three time points categorized into functional categories. The total of 196 represents all common mutants that were assigned a COG domain.

