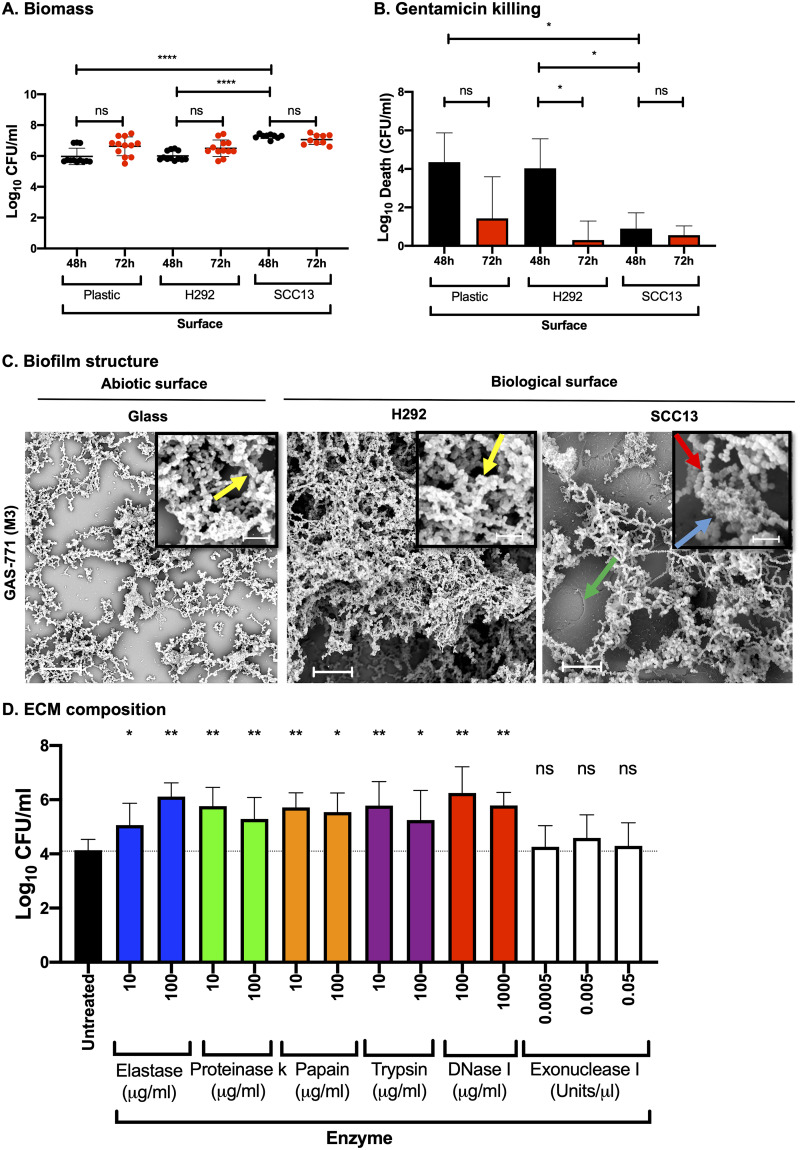
FIG 1.
Streptococcus pyogenes biofilm development, structure, and composition on abiotic versus biological surfaces. Biofilms were formed using S. pyogenes strain GAS-771 on abiotic (plastic) or biological (prefixed H292 cells or SCC13 keratinocytes) surfaces for various times at 34°C in CDM. (A) Biomass formation was evaluated by determining the log10 CFU per milliliter at 48 h (black dots) or 72 h (red dots). Data are from three separate experiments with three individual biofilms each (with standard deviations [SD]; n = 9), and data were compared using the Mann-Whitney U test. (B) Determination of gentamicin killing in GAS-771 biofilms was measured by calculating death in log10 CFU per milliliter (i.e., total biomass [CFU/ml] − biofilm biomass [CFU/ml] after treatment with 500 μg/ml gentamicin for 3 h) after 48 h (black bars) or 72 h (red bars). The results are means from three separate experiments of three individual biofilms each (with SD; n = 9), and data were compared using Student's t test. (C) The structure of GAS-771 biofilms formed on abiotic (glass) or biological (prefixed H292 epithelial cells or SCC13 keratinocytes) for 72 h was inspected using SEM (bar = 5 μm). Where visible, underlying cells are indicated by a green arrow. (Insets) Higher magnification (bar = 2 μm) of the biofilms, with arrows highlighting bacterial chains (red), ECM aggregates (blue), or bacterial chains coated with ECM (yellow). (D) To identify components present in the ECM, GAS-771 biofilms formed over 72 h at 34°C on prefixed epithelial H292 cells were treated with a set of proteases (elastase, proteinase K, papain, and trypsin) and DNases (DNase I and exonuclease I) at the indicated concentrations. After incubation, the log10 CFU/ml of bacteria released into the supernatant was determined. The results represent data from three separate experiments of two individual biofilms each (with SD; n = 6), and data were compared using the Mann-Whitney U test. *, P < 0.05; **, P < 0.01; ****, P < 0.0001; ns, nonsignificant difference.

