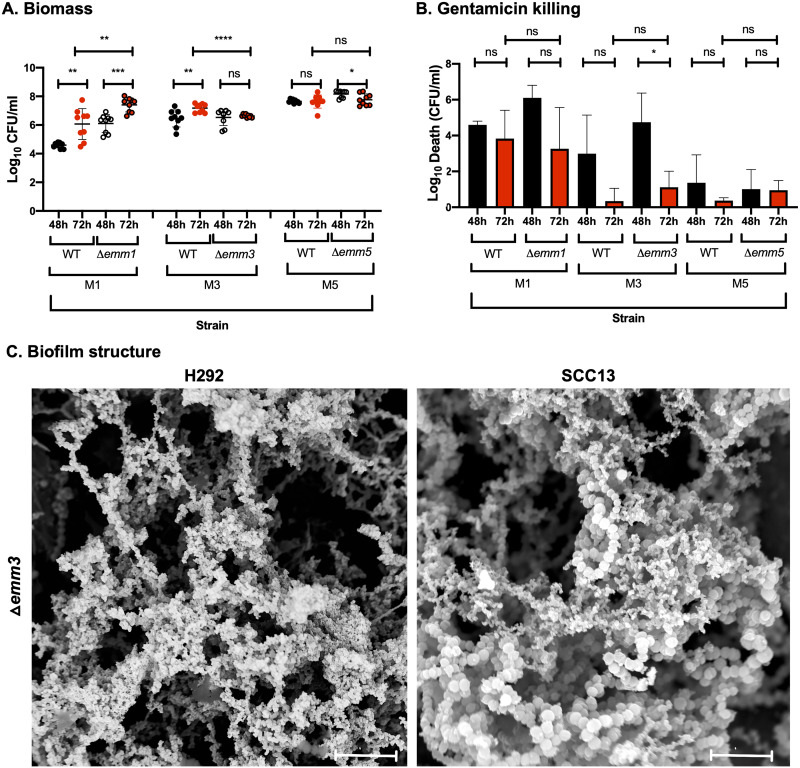
FIG 3.
Role of the M protein in GAS biofilm biomass, antibiotic resistance, and structure in strains lacking or expressing M protein. (A and B) Biofilms of M1 (SF370), M3 (GAS-771), and M5 (Manfredo) strains expressing wild-type M protein (WT) or lacking the M protein (Δemm) were formed over 48 (black) and 72 h (red) at 34°C on prefixed epithelial H292 cells and evaluated for biomass (A) or gentamicin killing (B) by measuring the log10 CFU per milliliter or the log10 death (i.e., total biomass [CFU/ml] − biofilm biomass [CFU/ml] after treatment with 500 μg/ml gentamicin for 3 h), respectively. Data are from three separate experiments with three individual biofilms each. Biomass is plotted as individual data points (with SD; n = 9), and groups were compared using the Mann-Whitney U test. Gentamicin killing data are means (with SD; n = 3), and groups were compared using Student's t test. *, P < 0.05; **, P < 0.01; ***, P < 0.001; ****, P < 0.0001; ns, nonsignificant difference. (C) The structure of biofilms formed by the Δemm3 mutant on different epithelial cells (respiratory H292 cells or SCC13 keratinocytes) for 72 h was viewed using SEM (bar = 5 μm). The cell substratum is not visible in the image due to the focus on capturing the biofilm structures.

