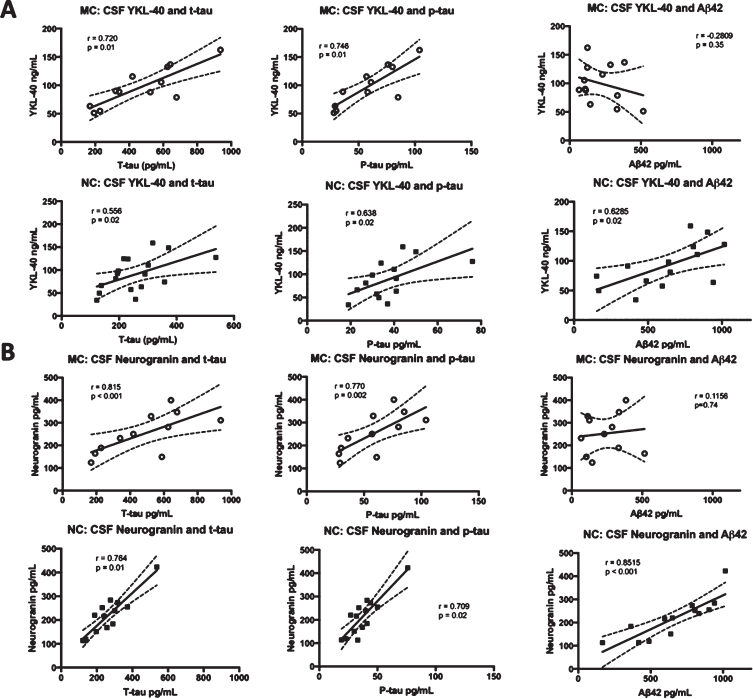
Fig. 1.
Correlations between the levels of CSF YKL-40 and neurogranin versus t-tau, p-tau, and Aβ42. Correlations between CSF YKL-40 (A) and neurogranin (B) and the clinically established CSF biomarkers t-tau, p-tau, and Aβ42 in FAD MC and NC. The solid lines indicate the linear-regression, the dotted lines represent the 95% confidence interval and the “r” represents the Pearson correlation coefficient when correlating Aβ42 to YKL-40 and neurogranin and the Spearman correlation coefficient when correlating t-tau and p-tau to YKL-40 and neurogranin. All the correlations were positive and significant except for the correlation between YKL-40 and Aβ42 in the MC group and between neurogranin and Aβ42, also in the MC group. The symbols represent individual values (filled symbols NC and white symbols MC) CSF, cerebrospinal fluid; FAD, familial Alzheimer’s disease; MC, mutation carriers; NC, non-carriers.

