Fig.6.
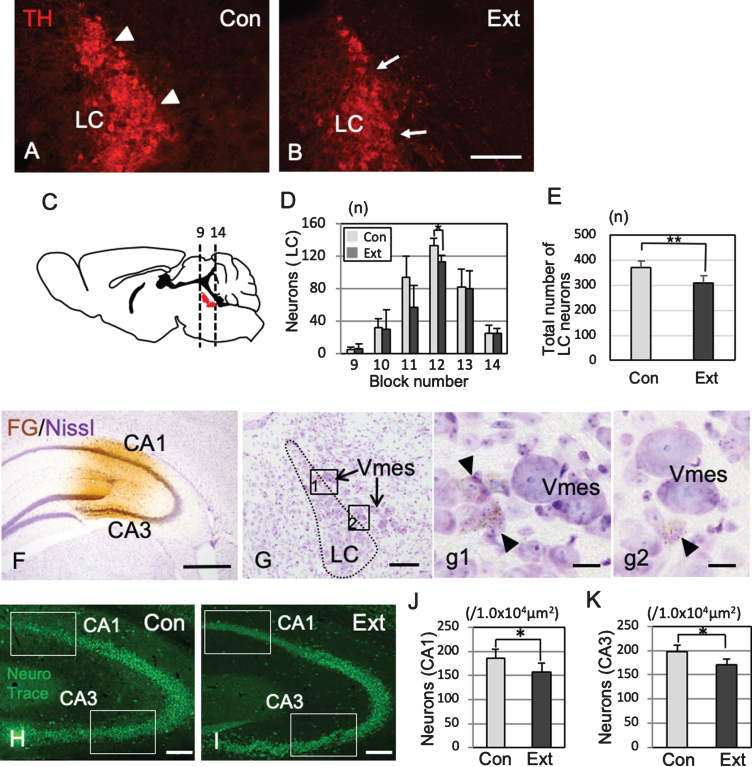
Association of neuronal loss between the LC and hippocampus after tooth extraction. A, B) Immunofluorescence images of TH-IR LC neurons in 5-month-old control 3×Tg-AD mice (Con) and 5-month-old 3×Tg-AD mice (1 month after tooth extraction) (Ext). The LC neurons linearly contact with the Vmes (arrowheads) (A), whereas irregularly contacts the Vmes (arrows) after tooth extraction (B). C) The number of LC neurons (red) in each block from the rostral (9) to caudal (14) ends of the Vmes. The block positions are the same as in Fig. 3. D) The number of LC neurons in each block from the rostral (9) to caudal (14) ends of the LC in 5-month-old 3×Tg-AD mice in the Con and Ext groups. The data are the means±SDs, n = 6. *p < 0.05, two-way ANOVA followed by Tukey’s post hoc analysis. **p < 0.01, unpaired t test. E) The total number of LC neurons in 5-month-old 3×Tg-AD mice in the Con and Ext groups. The data are the means±SDs, n = 10. *p < 0.01, unpaired t test. F) Fluorogold labeling was visualized with DAB in the CA1 and CA3 regions of the hippocampus. Nissl staining with 0.1% cresyl violet was used to visualize neurons. G) Retrograde labeling of the LC close to the Vmes. g1, 2) Higher magnification images of the rectangle in (G). Fluorogold labeling in LC neurons (arrowheads). H, I) The position of the measured area (rectangular area) was in the CA1 and CA3 regions of the hippocampus in 7-month-old control 3×Tg-AD mice without tooth extraction (Con) (H) and 3×Tg-AD mice with tooth extraction (Ext) (I). Neuro Trace green staining. J, K) The number of neurons in the CA1 (J) and CA3 (K) regions of the hippocampus in 7-month-old control 3×Tg-AD mice without tooth extraction (Con) and 3×Tg-AD mice with tooth extraction (Ext). The data are the means±SDs, n = 10. *p < 0.01, unpaired t test. Scale bars: B, F, H, I, 500μm; G, 200μm; g1, g2, 10μm.

