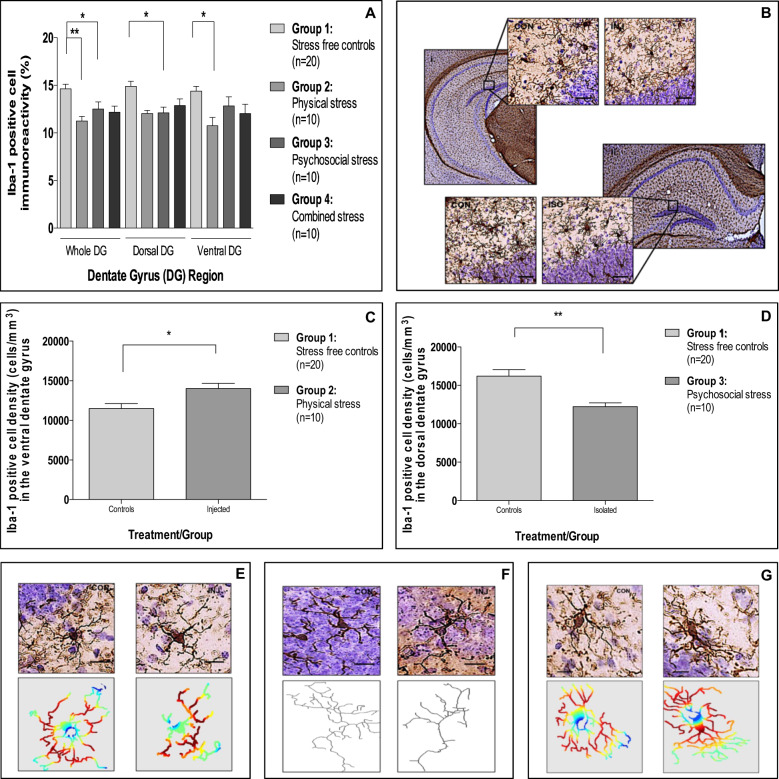
Fig. 4. Effect(s) of repeated injection, social isolation and combined stress on microglial biology.
a Mean (±SEM) Iba1-positive cell immunoreactivity in the dentate gyrus (Effect of exposure: F[3,138] = 5.7, p = 0.002; Effect of region: F[2,138] = 1.2, p = 0.29; Interaction: F[3,138] = 0.9, p = 0.45). b Representative photomicrographs of the ventral (i) and dorsal (ii) dentate gyrus stained for Iba1 for repeatedly injected and socially isolated mice, respectively, all relative to controls. Images captured at ×2 and ×20 magnification, scale bar = 50 μm. c mean (±SEM) Iba1-positive cell density in the ventral dentate gyrus for repeatedly injected mice (t [28] = 2.7, p = 0.02). d Mean (±SEM) Iba1-positive cell density in the dorsal dentate gyrus for socially isolated mice (t [28] = 4.2, p = 0.001). e Representative photomicrographs and associated sholl masks of Iba1 cells in the ventral dentate gyrus of repeatedly injected and control animals. f Representative photomicrographs and associated skeletons of Iba1 cells in the ventral dentate gyrus of repeatedly injected and control animals. g Representative photomicrographs and associated sholl masks of Iba1 cells in the dorsal dentate gyrus of socially isolated and control animals. Images e–g were taken at ×40 magnification, scale bar = 40 μm. In Sholl masks, red denotes a greater degree of branching complexity, whereas blue denotes the lowest degree of branching complexity. *p < 0.05; **p < 0.01; ***p < 0.001 (adjusted p-values). Analyses: two-way ANOVA with Bonferroni post hoc comparison or Independent samples t-test.

