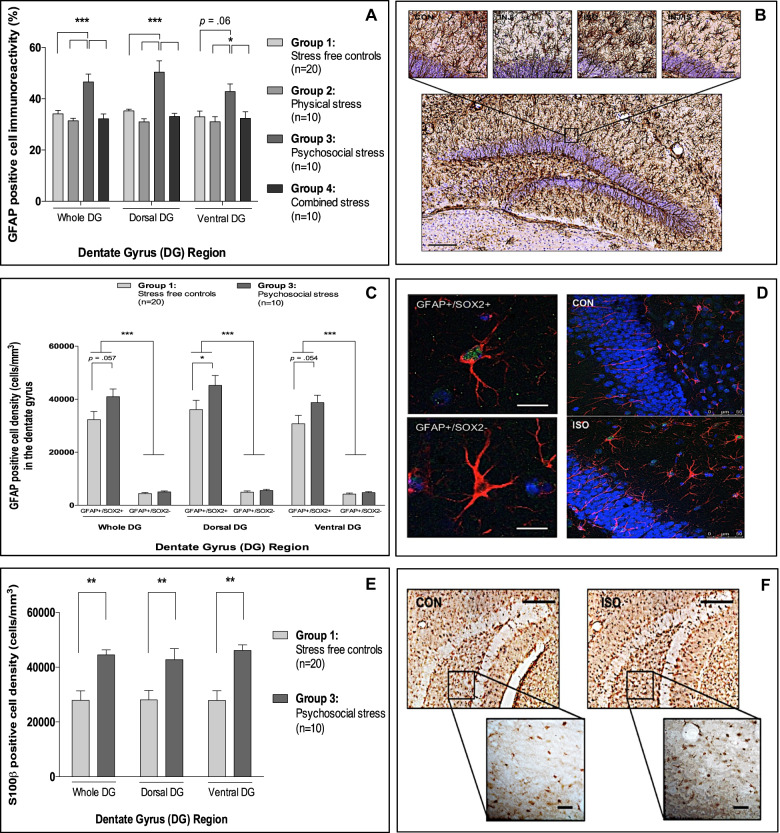
Fig. 5. Effect(s) of repeated injection, social isolation and combined stress on astrocyte biology.
a Mean (±SEM) GFAP-positive cell immunoreactivity in the dentate gyrus (Effect of exposure: F[3,138] = 15.7, p < 0.001; Effect of region: F[2,138] = 2.1, p = 0.15; Interaction: F[3,138] = 0.9, p = 0.45). b Representative photomicrograph of the dorsal dentate gyrus from a representative control stained for GFAP (×10 magnification; scale bar = 100 μm) and close-up representative photomicrographs for each experimental group (×20 magnification; scale bar = 50 μm). c mean (±SEM) GFAP-positive cell density in the dentate gyrus stratified by GFAP cell type and dentate gyrus region (Effect of exposure (a): F[1,168] = 6.9, p = 0.01; Effect of region (b): F[2,168] = 3.6, p = 0.06; Effect of cell type (c): F[1,168] = 350.8, p < 0.001. Interactions: (a × b) F[1,168] = 0.03, p = 0.87; (a × c) F[1,168] = 5.2, p = 0.03; (b × c) F[1,168] = 2.2, p = .15; (a × b × c) F[1,168] = 0.02, p = 0.88). d Representative photomicrographs of a radial glial cell (GFAP+/SOX2+) and astrocyte (GFAP+/SOX2−) taken from socially isolated animals (×40 magnification; scale bar = 40 μm) and representative maximum intensity 2D z-stack projections of ten confocal images taken from socially isolated and control animals (×20 magnification; scale bar = 50 μm). e Mean (±SEM) s100β-positive cell density in the dentate gyrus (Effect of exposure: F[1,84] = 24.0, p < 0.001; Effect of region: F[2,84] = 0.2, p = 0.64; Interaction: F[1,84] = 0.3, p = 0.61). f Representative photomicrographs of s100β-positive cells in the ventral dentate gyrus of controls and socially isolated mice (×40 magnification; scale bar = 50 μm). *p < 0.05; **p < 0.01; ***p < 0.001 (adjusted p-values). Analyses: two-way ANOVA with Bonferroni post hoc comparison or three-way factorial ANOVA with Bonferroni post hoc comparison.

