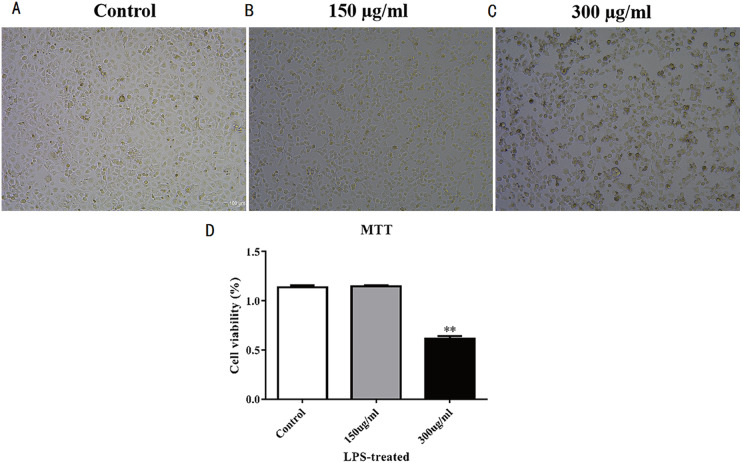
Figure 2. Establishment of LPS-induced acute lung injury model.
(A–C) Cell proliferation morphology of each group after high-concentration LPS treatment. Three groups that were studied are as follows: control, 150 μ g/mL LPS-treated, and 300 μ g/mL LPS-treated. (D) MTT detection of MLE-12 cell proliferation after LPS treatment for 48 hours. The results showed the proliferation of MLE-12 cells in the 300 μ g/mL LPS-treated group slowed down.

