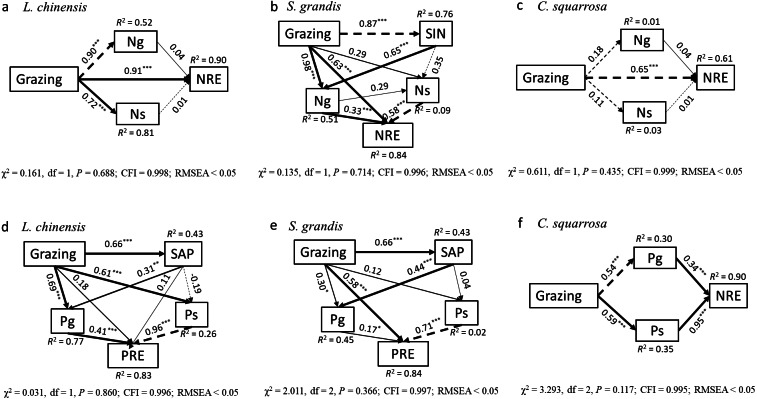
Figure 4. Path analyses on the impacts of and path analyses on the impacts of overgrazing on nitrogen resorption efficiency and phosphorus resorption efficiency of three dominant plant species.
Path analyses on the impacts of and path analyses on the impacts of overgrazing on nitrogen resorption efficiency (A, B, C) and phosphorus resorption efficiency (D, E, F) of three dominant plant species (L. chinensis; G. grandis; S. squarrosa).Solid and dashed arrows represent significant (P < 0.05, marked *; P < 0.01, marked **; P < 0.001, marked *** in the figure) and non-significant (P > 0.05) paths. Values associated with arrows represent standardized path coefficients. SIN, soil inorganic nitrogen content; Ng, nitrogen concentrations of green leaves; Ns, nitrogen concentrations of senesced leaves; NRE, nitrogen resorption efficiency; SAP, available phosphorus content; Pg, phosphorus concentrations of green leaves; Ps, phosphorus concentrations of senesced leaves.

