
Figure 1.
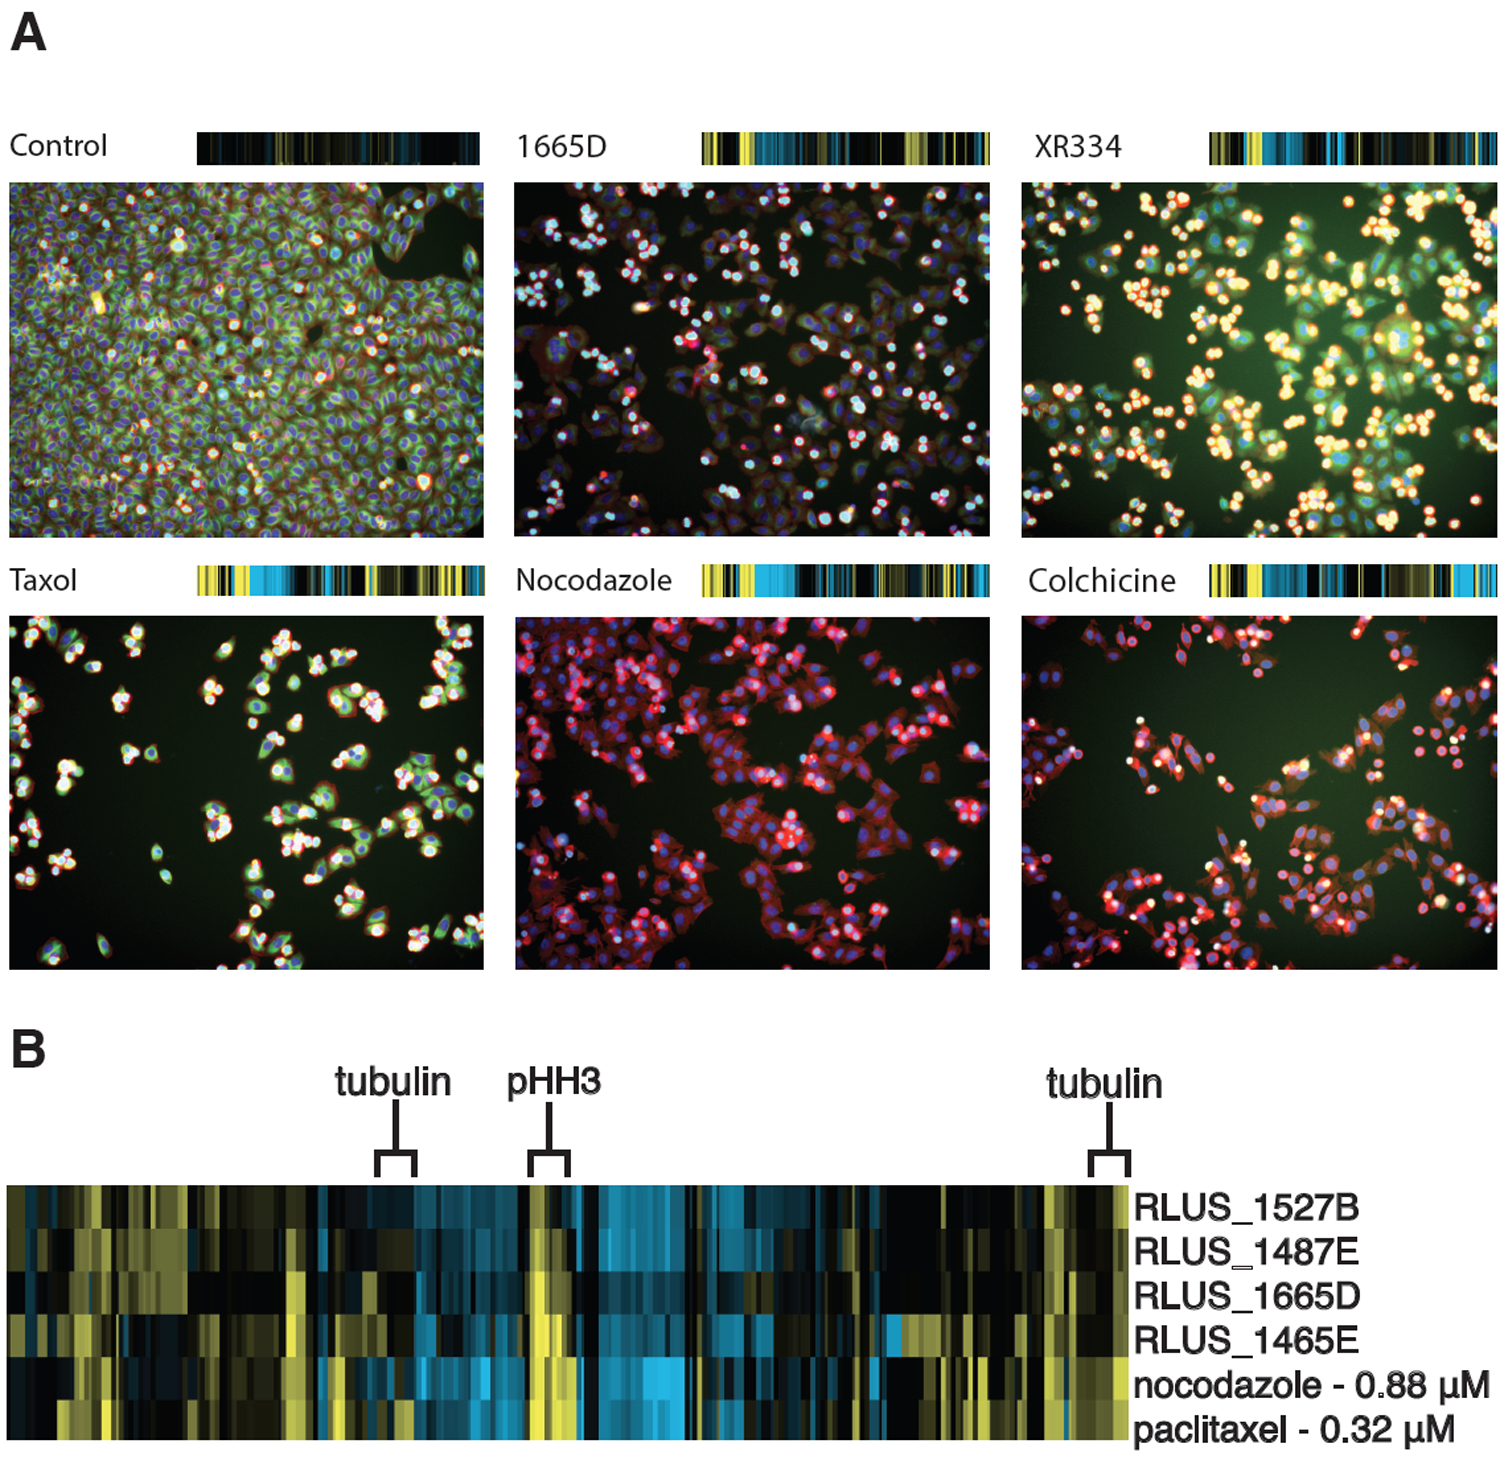
(A) Fluorescence images of drug-treated wells all showing deviations in tubulin (green) and mitotic cells (cyan) from the control. The corresponding phenotypic fingerprint generated from the image analysis is shown above each well image.(27) (B) Cytological profiling fingerprint of original natural products extracts and microtubule poisons. Positive deviations from DMSO-treated wells are displayed in yellow; negative deviations are displayed in blue. Features highlighted for tubulin and mitotic cells display an increase in mitotic cells and variable tubulin staining.