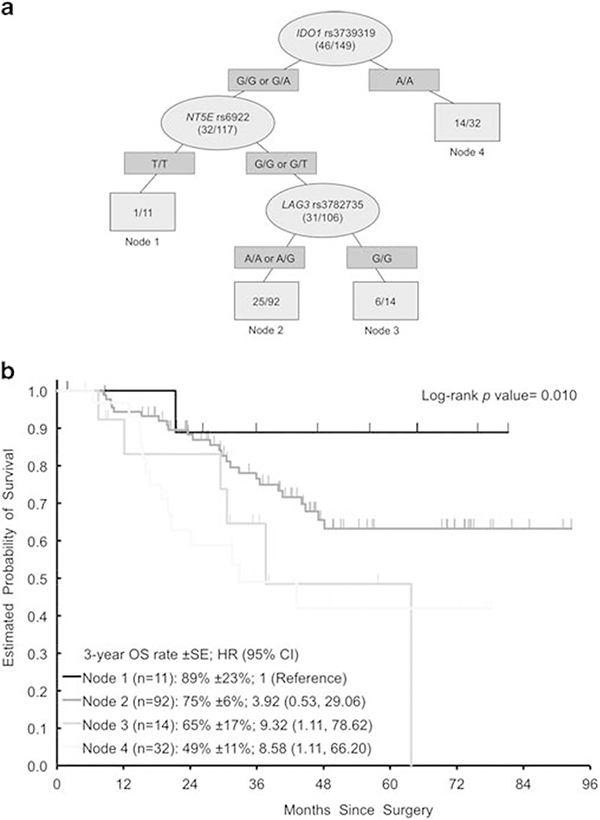
Figure 5.
(a) Recursive Partitioning for OS. Light gray ovals represent intermediate subgroups; light gray squares represent terminal nodes. Dark gray rectangles indicate predictive polymorphism. Fractions within nodes indicate patients who died per total patients with that node. Node 1 represents low-risk patients; Node 2 represents intermediate-risk patients. Node 3, 4 represent high-risk patients. (b) Kaplan–Meier curves for OS nodes. HR, hazard ratio; OS, overall survival.

