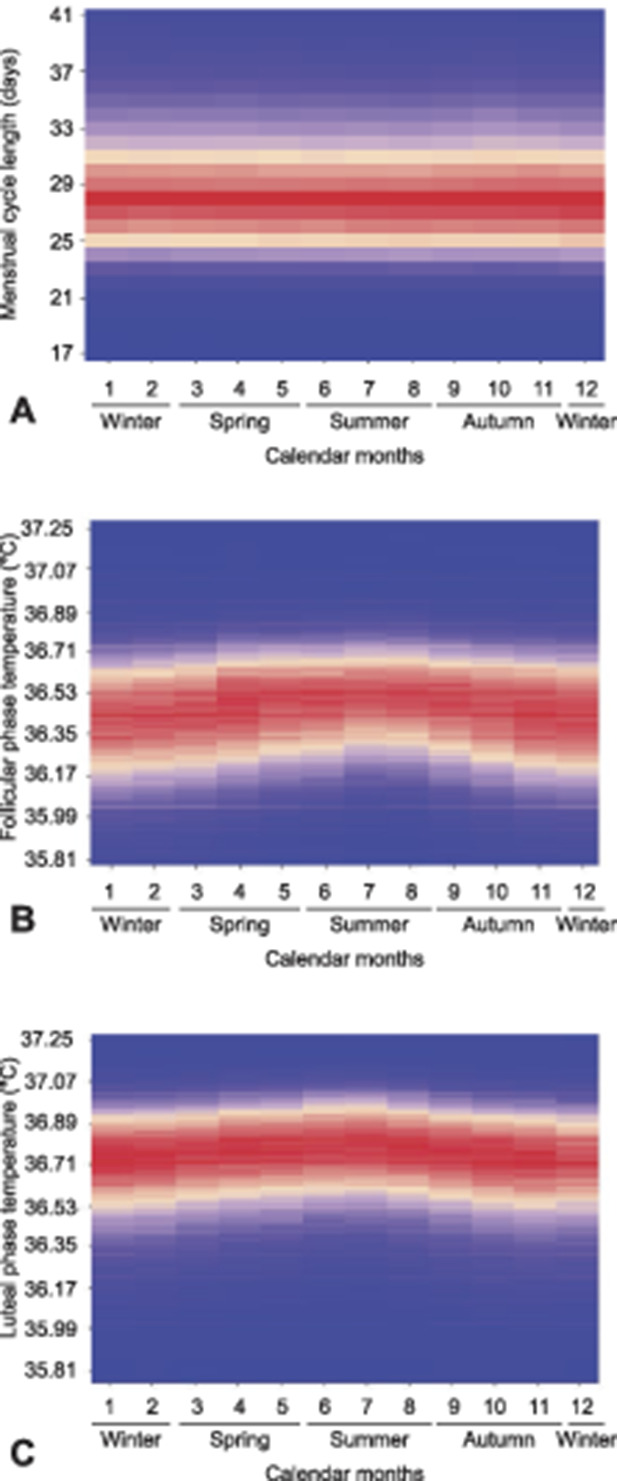
Fig. 2. Seasonality of menstrual cycle length (A), follicular phase temperature (B), and luteal phase temperature (C). Probability densities were calculated for each month, and their distributions are shown in the heat maps.

Tatsumi. Changes in Menstrual Cycle Length and Body Temperature. Obstet Gynecol 2020.
