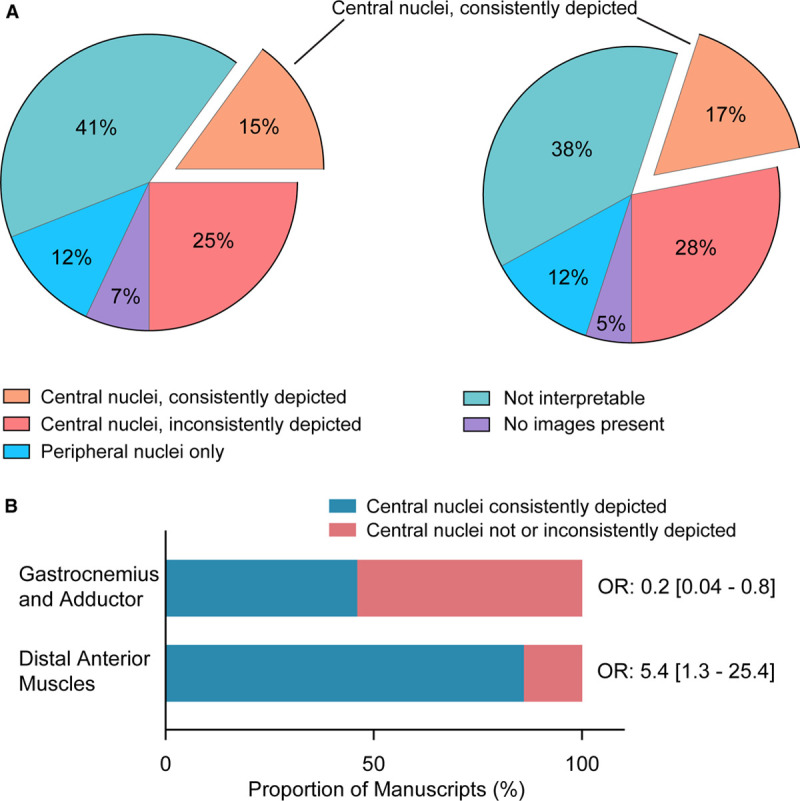
Figure 8.

Analysis of injured muscle zones depicted in the published literature evaluating postischemia angiogenesis. A, Pie charts showing the distribution of manuscripts based on the state of the skeletal myofibers evaluated for postinjury angiogenesis, as depicted in the representative histology images. Chart on the left is for all 509 manuscripts; chart on the right is for the 283 unique senior author manuscripts. B, Depiction of the probability of there being centralized nuclei in histological images of tissues from mice subjected to femoral artery excision, depending on the specific muscles analyzed. Data on right indicate the odds ratio (OR) and 95% CIs for there being central nuclei present in the images.
