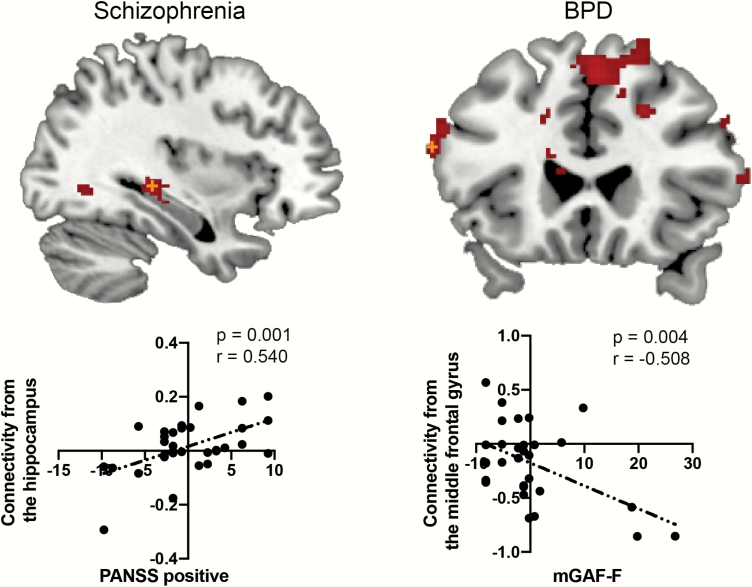
Fig. 2.
The association between functional connectivity and psychiatric symptoms. The orange cross depicts the peak voxel. The y-axis of the scatter plot depicts connectivity values (z-value) from the group-level significant clusters, while the x-axis depicts demeaned scores of psychiatric symptoms.

