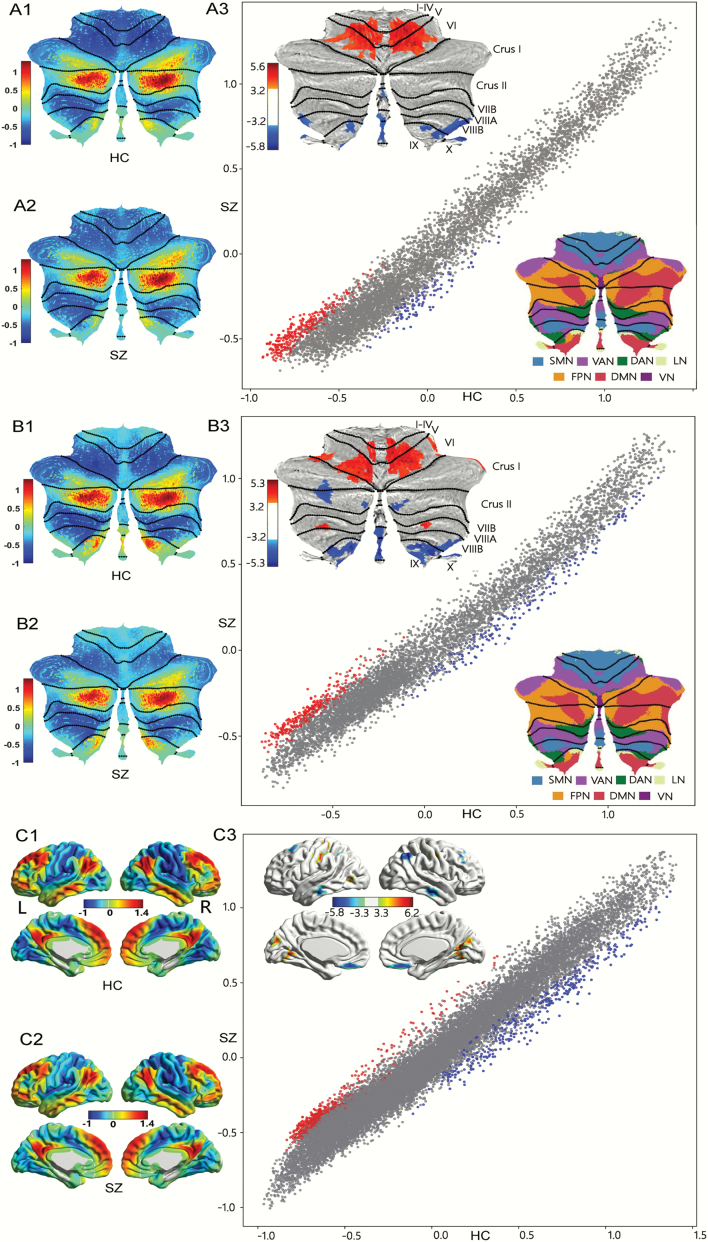
Fig. 2.
Group patterns and differences in principal gradient. (A) Cerebellar principal functional gradient calculated based on intra-cerebellar functional connectivity. (A1) Gradient pattern in HC. (A2) Gradient pattern in SZ. (A3) Group differences between SZ and HC. Scatterplot represents cerebellar gradient of SZ (y axis) vs cerebellar gradient of HC (x axis). Scatterplot colors correspond to group differences map as shown in top-left corner of figure 2 (A3): higher gradient value in SZ (red), and lower gradient value in SZ (blue) compared to HC. (B) Cerebellar principal functional gradient calculated based on FC between cerebellum and cerebral cortex. (B1) Gradient pattern in HC. (B2) Gradient pattern in SZ. (B3) Group differences between SZ and HC. Scatterplot represents cerebellar gradient of SZ (y axis) vs cerebellar gradient of HC (x axis). Scatterplot colors correspond to group differences map as shown in top left corner of figure 2 (B3): higher gradient value in SZ (red), and lower gradient value in SZ (blue) compared to HC. (C) Cerebral principal functional gradient calculated based on FC between the cerebral cortex and cerebellum. (C1) Gradient pattern in HC. (C2) Gradient pattern in SZ. (C3) Group differences between SZ and HC. Scatterplot represents cerebellar gradient of SZ (y axis) vs cerebral gradient of HC (x axis). Scatterplot colors correspond to group differences map as shown in top left corner of figure 2 (C3): higher gradient value in SZ (red), and lower gradient value in SZ (blue) compared to HC. All results for each gradient are shown after FDR correction (P < .05/3). Cerebellar representations of cerebral cortical resting-state networks40 are shown in bottom right corner of figure 2 (A3 and B3) based on Buckner et al.40

