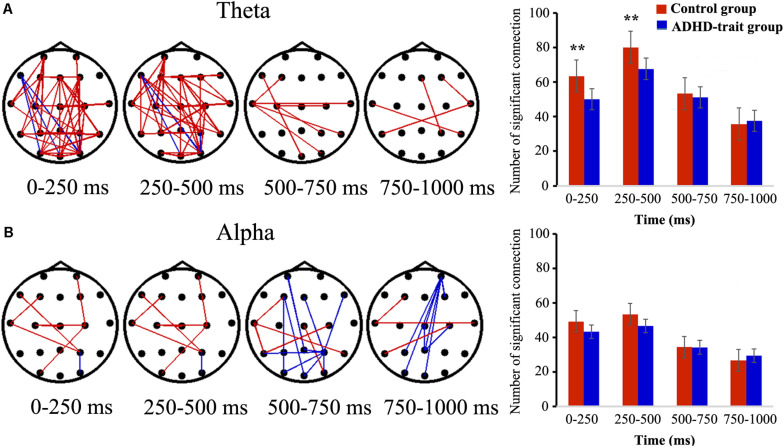
FIGURE 3.
Spatiotemporal pattern of TPLVs (A) and APLVs (B). Red: the control group has a significantly higher connectivity strength than the ADHD-trait group; blue: the ADHD-trait group has a significantly higher connectivity strength compared with the control group (left panels) (p < 0.05). The right panels show the time courses of the mean number of significant connections between the two groups (error bar: standard error, **p < 0.01).

