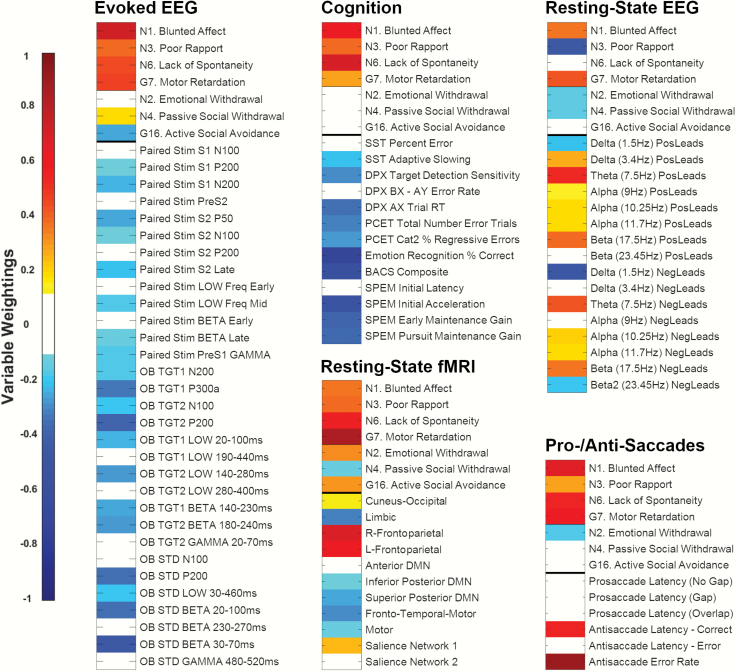
Fig. 1.
Each biomarker modality shows a distinct pattern of multivariate associations with negative symptoms. Note: The heat maps show the loading strength of individual negative symptoms and biomarker variables on their respective latent variates for each canonical correlation analysis. Warmer colors indicate stronger positive loadings; cooler colors indicate stronger negative loadings. For clarity, loadings between −.1 and .1 are shown in white. Paired Stim, auditory paired stimulus paradigm; S1/S2, the first or second paired stimulus; OB STD, auditory oddball standard stimuli; TGT1/2, PCA component 1/2 for auditory oddball target stimuli; SST, stop signal task; DPX, dot probe expectancy task; PCET, Penn conditional exclusion task; SPEM, smooth pursuit eye movements; PosLeads, mean of spatial leads that were positively correlated with the frequency component; NegLeads, mean of spatial leads that were negatively correlated with the frequency component; DMN, default mode network.

