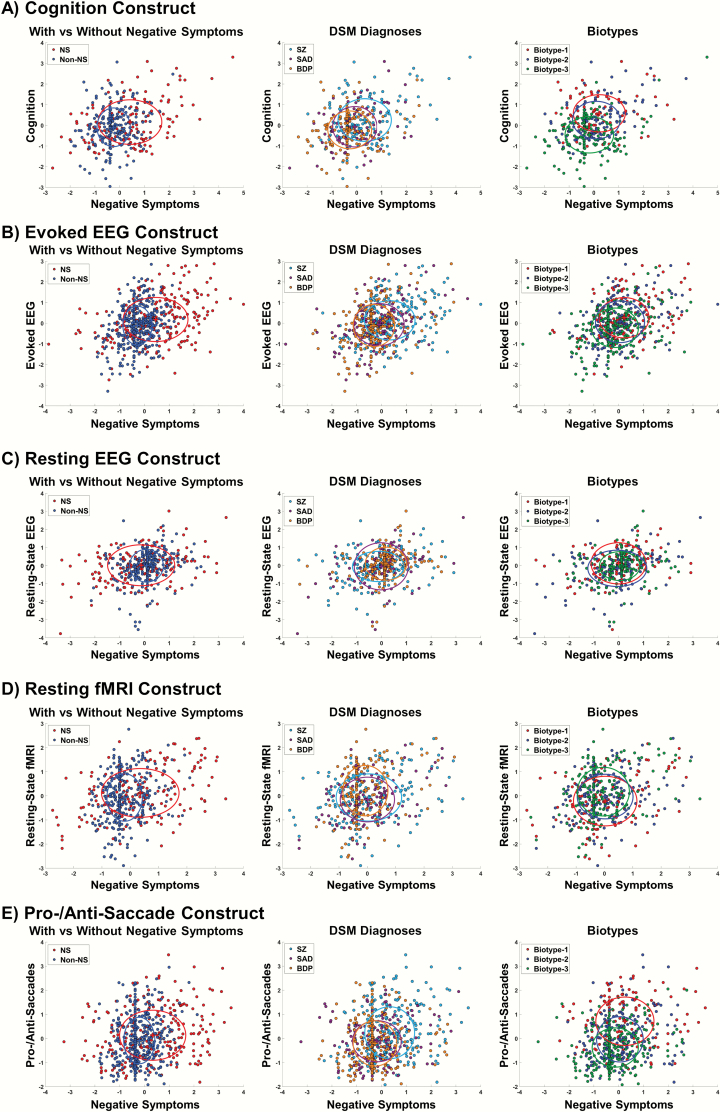
Fig. 2.
Scatterplots of canonical variate scores color coded by probands with vs without predominant negative symptoms (left), clinical diagnosis (middle), and Biotype (right) indicate largely overlapping subgroups. Note: Scores represent the sum of the standardized data weighted by the loading strength of individual negative symptoms and biomarker variables on their respective latent variates for each canonical correlation analysis. Each dot is an individual participant. The color-coded crosses and ellipsoids show the centroids and ±1 SD for each subgroup.

