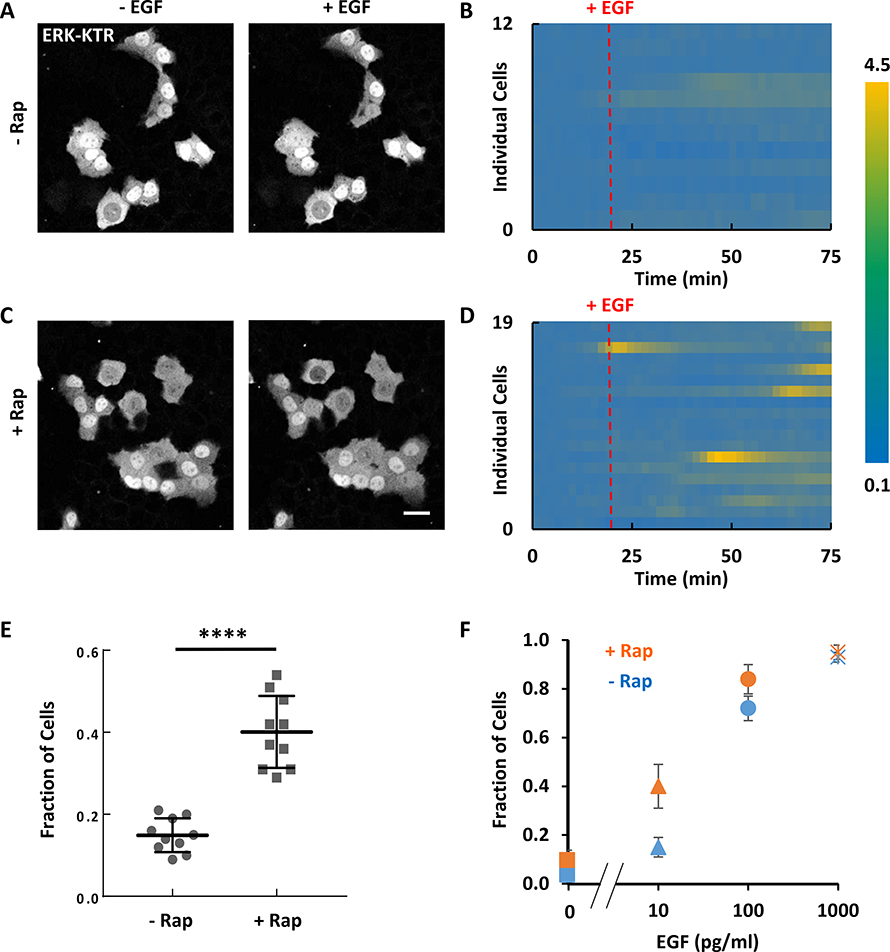
Figure 5. PI(4,5)P2 reduction lowers the threshold of ERK activation in MCF-10A cells.
(A-D) Responses of ERK-KTR to 10 pg/ml EGF stimulation in MCF-10A cells without (A and B) and with (C and D) PIP2 reduction by rapamycin-induced recruitment of Inp54p. Ratios of cytosolic to nucleus ERK-KTR signal over time for 12 and 19 individual cells are plotted in (B) and (D).
(E) Fraction of cells showing at least 50% increase in the ratio of cytosolic to nucleus intensity of ERK-KTR in response to 10 pg/ml EGF global stimulation without or with PIP2 reduction by rapamycin-induced recruitment of Inp54p (mean ± S.D. of N = 10 experiments). Unpaired t test with Welch’s correction, P < 0.0001.
(F) Fraction of cells responding to global stimulation of various concentrations of EGF in cells without or with PIP2 reduction by rapamycin-induced recruitment of Inp54p (mean ± S.D. of N = 10 experiments).
Cells were starved in pure DMEM/F-12 medium for 24 hours before stimulation. Scale bar labeled on images is 20 μm.

