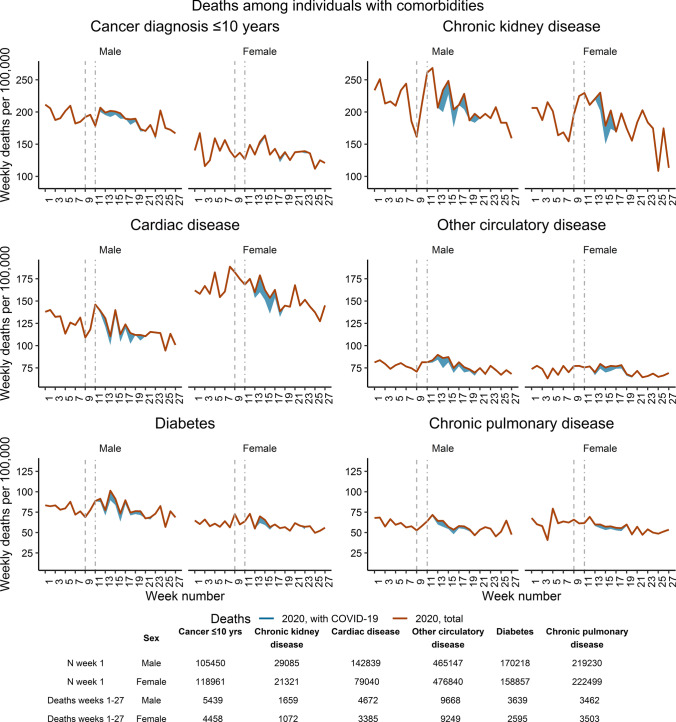
Fig. 4.
Mortality rates in weeks 1–27 in for patients with pre-existing chronic conditions in. Incident cases only counted at the start of the next whole week. Vertical lines at weeks 9 and 11 indicate the first coronavirus case and lockdown measures, respectively. Week numbers according to the ISO 8601 standard (i.e. week 1 of 2020 starts on 30 December). The blue shaded space represents deaths with COVID-19, only displayed for > 3 deaths per week. Note, different sum than in Table 2, due to only counting incident cases in the following week. Also note different Y-axis scales for the rows

