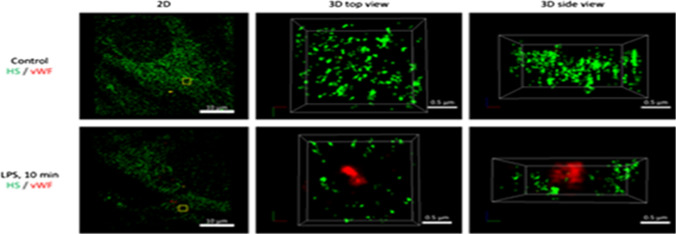
Figure 13.
Representative STORM-acquired images of anti-HS labeled EG and vWF-labeled WPBs distribution in control and 10 min post-LPS. The left panel shows 2D images of a region of ~ 40 µm x 40 µm at the apical surface of cultured mouse brain microvascular endothelial cell (EC). An enlarged top view of a yellow box (~ 2 µm x 2 µm) in the left panel is shown in the middle panel and its side view in the right panel. The EC surface is at the bottom of the side view. Upper panels are for the control and bottom ones for after 10 min LPS treatment. Reprinted from Ref. 248.

