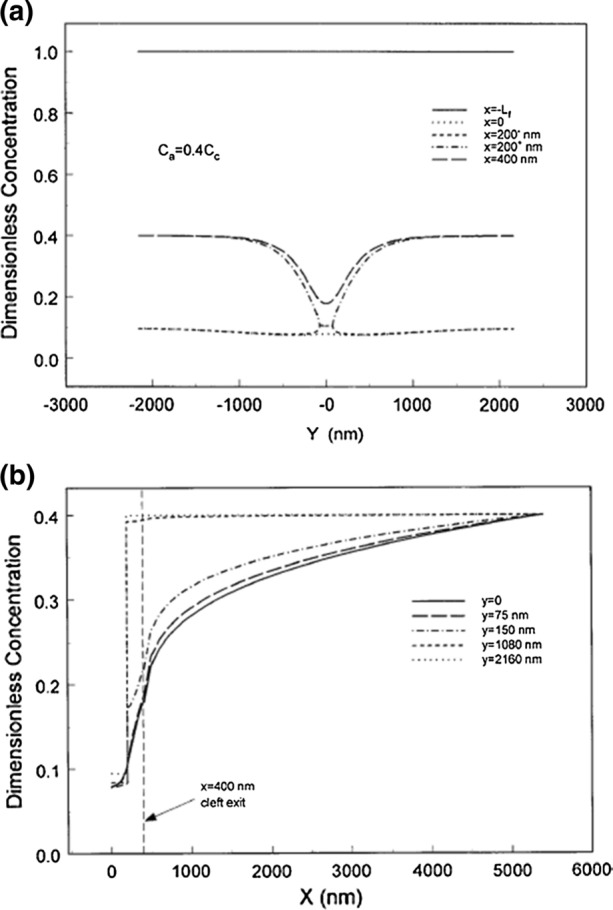
Figure 6.

Predictions of theoretical model for Pc = 43 cm H2O for concentration profiles in the cleft along x (a) and along y (b) when there is a parallel non-convective pathway for albumin which increases the tissue concentration at the edge of region B, Ca, to 0.4Cc. Flow geometry is shown in Fig. 3. Plasma oncotic pressure is 26 cm H2O and σ = 0.94. Reprinted from Ref. 78.
