Figure 3.

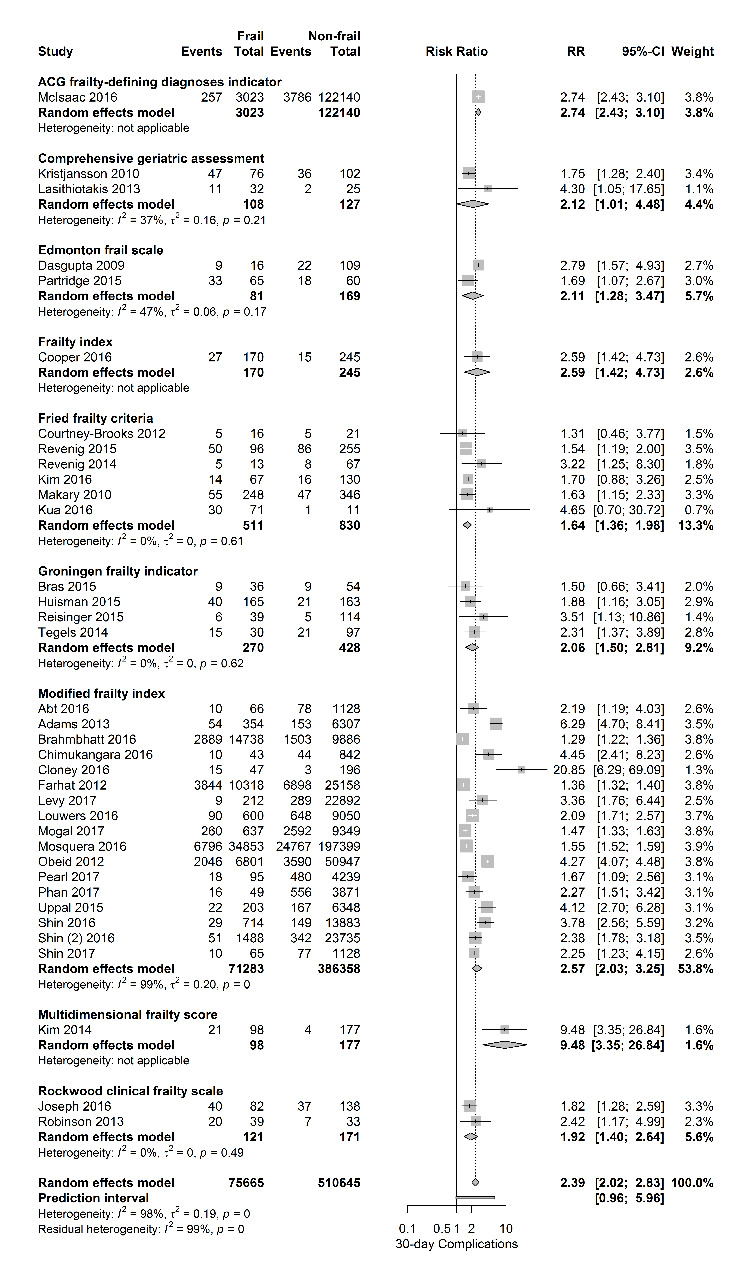
Forest plot postoperative complications per frailty score. The number of events (complications) and the total number of patients are shown for both frail and non-frail patients, stratified per frailty assessment tool.

Forest plot postoperative complications per frailty score. The number of events (complications) and the total number of patients are shown for both frail and non-frail patients, stratified per frailty assessment tool.