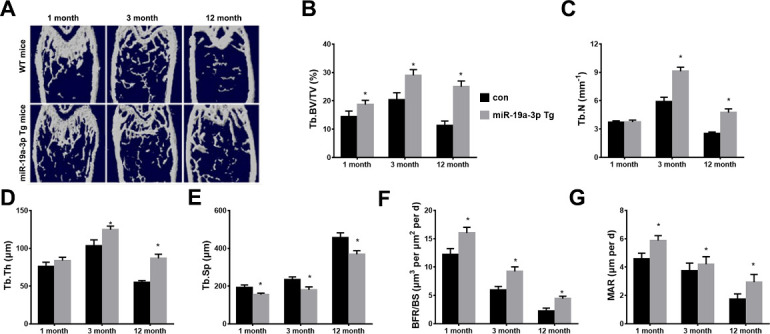
Figure 2.

The age-associated bone loss in miR-19a-3p Tg mice. (A) The μCT images of WT mice and miR-19a-3p Tg mice at 1, 3 and 12 months old. B-E, quantitative μCT analysis of trabecular bone microarchitecture. (B) Tb. BV/TV, trabecular bone volume per tissue volume. (C) Tb.N, trabecular number. (D) Tb.Th, trabecular thickness. E, Tb.Sp, trabecular separation. (F, G) Representative images of calcein double labelling of trabecular bone, (G) with quantification of BFR per bone surface BFR/BS, H, and mineral apposition rate MAR. Data shown as mean ± SD, *p <0.05.
