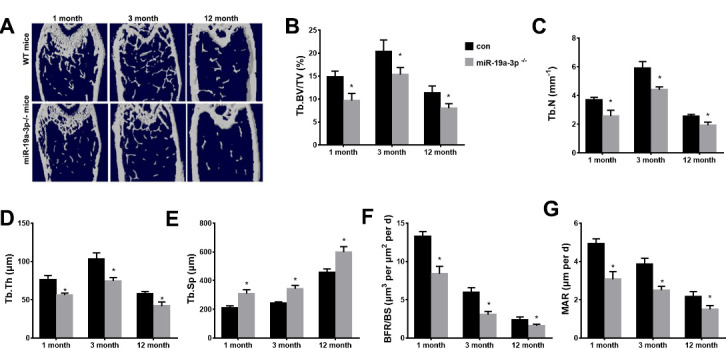
Figure 3.

Age-associated bone loss in miR-19a-3p knockout mice. (A) μCT images of WT mice and miR-19a-3p-/-mice at 1, 3 and 12 months old. B-E, quantitative the trabecular bone microarchitecture. (B) Tb. BV/TV, trabecular bone volume per tissue volume. (C) Tb.N, trabecular number. (D) Tb.Th, trabecular thickness. (E) Tb.Sp, trabecular separation. (F, G) quantification of BFR/BS and MAR. (F) with quantification of BFR per bone surface (BFR/BS); (G) mineral apposition rate (MAR). Data shown as mean ± SD. *p <0.05.
