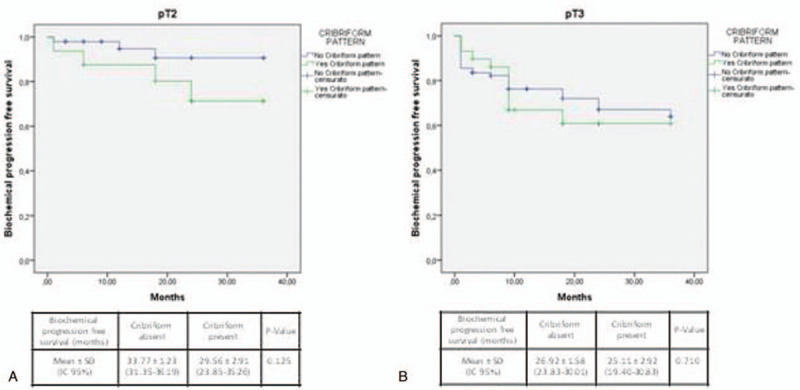
Figure 4.

Kaplan-Meier curve showing biochemical progression-free survival following radical prostatectomy according to pathologic T-stage and cribriform pattern. (A) pT2 (log Rank Mantel—Cox: χ2 2.356; P = .125) and (B) pT3 (log Rank Mantel—Cox: χ2 0.139; P = 0.710).
