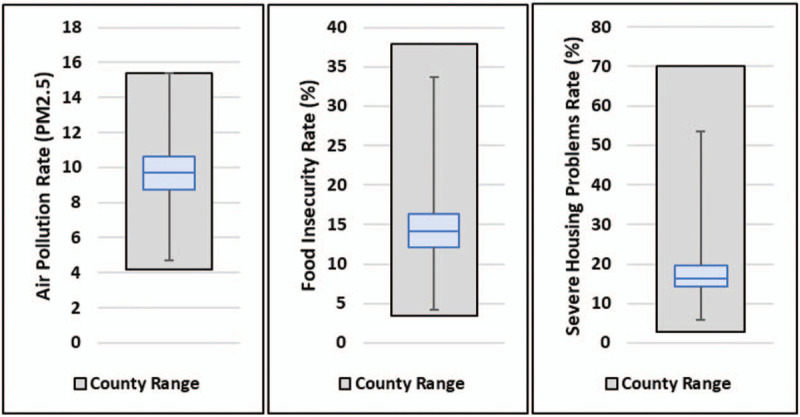
Figure 2.

Range of average SRF exposure of hospitals’ dual eligible patients. Authors’ analysis of County Health Rankings and Roadmaps database (county range) and Medicare claims data, 2016. Upper whisker—maximum hospital (highest exposure). Lower whisker—minimum hospital (lowest exposure). Horizontal blue line = median hospital. Blue box: 25th to 75th percentile hospital.
